Assessing Variable Independence: A Step-By-Step Guide With Key Indicators
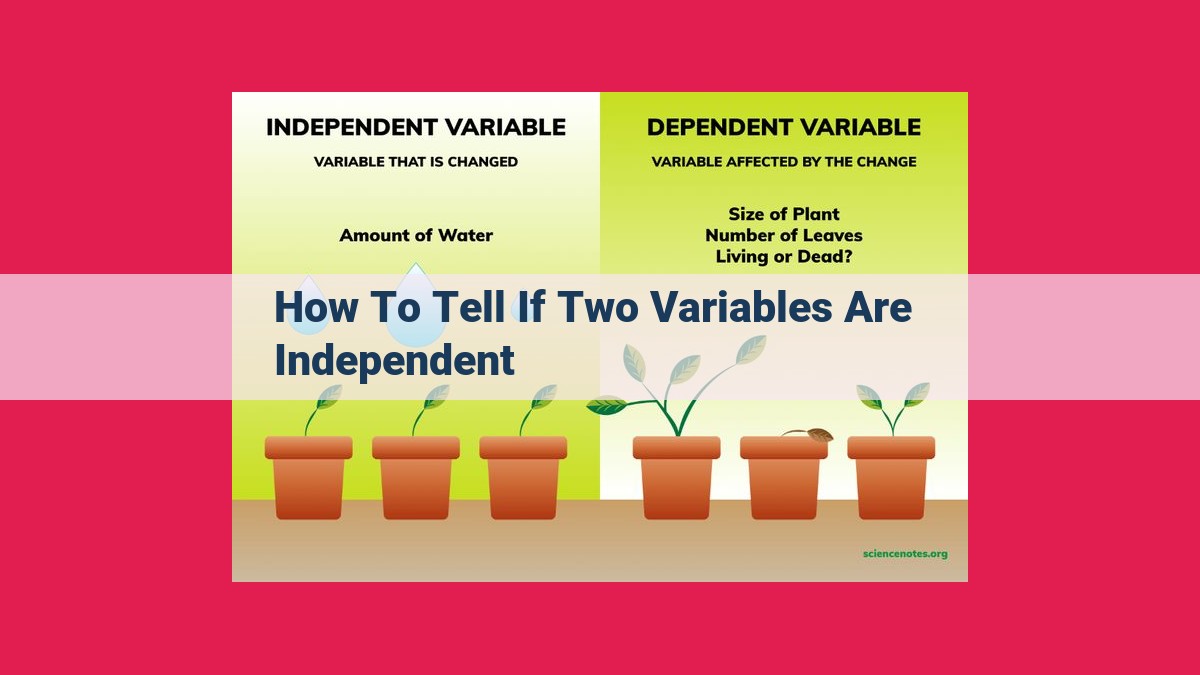
To determine if two variables are independent, follow these steps: 1. Examine a scatterplot; if the points form a random pattern, the variables may be independent. 2. Calculate correlation: near zero indicates independence. 3. Check covariance: if it’s close to zero, the variables are likely independent. 4. Apply conditional probability: If one variable’s probability remains unchanged given the value of the other, they are independent.
Understanding Scatterplots, Correlation, and Covariance
Visualizing Relationships with Scatterplots
In statistics, understanding the relationship between two variables is crucial. Scatterplots are a powerful tool for visualizing this relationship, allowing us to see how one variable changes in relation to another. By plotting data points on a graph, we can identify patterns and trends that may not be evident from numerical data alone.
Correlation: Measuring Linear Relationships
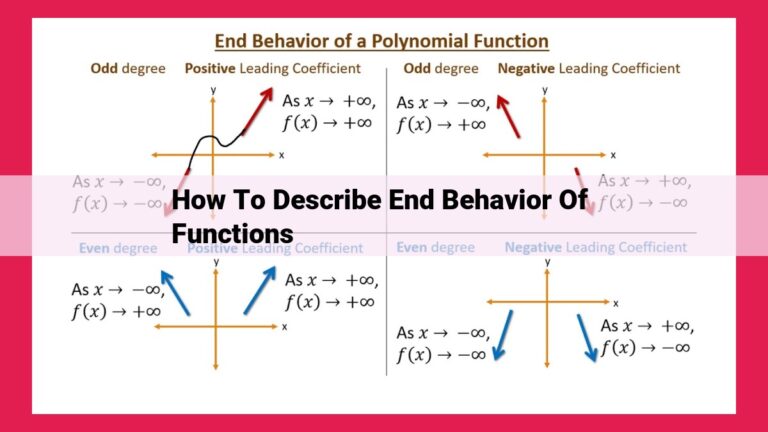
Correlation quantifies the strength and direction of the linear relationship between two variables. A positive correlation indicates that as one variable increases, the other tends to increase as well. A negative correlation shows that as one variable increases, the other generally decreases. The strength of the relationship is measured by a coefficient that ranges from -1 to 1. A coefficient of 1 represents a perfect positive correlation, -1 represents a perfect negative correlation, and 0 indicates no linear relationship.
Covariance: Measuring Joint Variability
Covariance measures the joint variability of two variables. It captures how much the two variables vary together, regardless of whether the relationship is linear. A positive covariance indicates that the variables tend to vary in the same direction, while a negative covariance suggests they vary in opposite directions. The magnitude of the covariance reflects the degree of variability, with a larger absolute value indicating greater variability.
Exploring Dependence and Independence: A Statistical Perspective
When studying the relationship between two variables, understanding their dependence or independence is crucial. This blog post delves into these concepts, providing insights into how statistical tools can help you determine the nature of the relationship between variables.
Dependence: When Variables Dance Together
Dependence occurs when changes in one variable are accompanied by predictable changes in another. Think of two friends whose ages share a close connection: as one grows older, so does the other. Scatterplots, graphical representations of the relationship between two variables plotted on the x and y axes, can illustrate this dependence. A positive correlation, indicated by an upward trend in the scatterplot, signifies that the variables move in the same direction – one increases as the other increases. Conversely, a negative correlation, represented by a downward trend, suggests that the variables move in opposite directions – as one increases, the other decreases.
Independence: When Variables Go Their Separate Ways
In contrast to dependence, independence arises when changes in one variable have no effect on the other. Imagine two unrelated events: the outcome of a coin toss and the weather forecast for tomorrow. A scatterplot depicting independent variables would appear as a random distribution of points, with no discernible pattern or correlation.
Using Scatterplots: A Visual Guide to Dependence and Independence
Scatterplots offer a powerful tool for visualizing the relationship between variables. By examining the pattern of points, you can quickly assess whether the variables are dependent or independent. If the points form a distinct line or curve, dependence is likely present. Conversely, a scattered distribution of points suggests independence.
Examples in Action
Consider two variables: the height of a person and their shoe size. It’s reasonable to expect that taller people tend to have larger feet, illustrating a positive correlation. On the other hand, the gender of a person and their favorite food are likely independent – one’s gender doesn’t influence their culinary preferences.
Understanding dependence and independence is essential for accurate data analysis and interpretation. Statistical tools like scatterplots and correlation analysis can help determine the nature of the relationship between variables, providing valuable insights into the underlying patterns and connections in our world. Always remember to consider the context and apply statistical methods appropriately to draw meaningful conclusions from your data.
Conditional Probability and Independence
In the realm of probability, we often seek to understand the relationship between events. Conditional probability allows us to calculate the likelihood of one event occurring given that another event has already happened.
Consider the scenario of drawing a card from a standard deck. Let’s say we’re interested in the probability of drawing a heart. The unconditional probability of drawing a heart is 13/52, since there are 13 hearts in the deck and 52 cards in total.
Now, suppose we’re curious about the conditional probability of drawing a heart given that we’ve already drawn a red card. The deck now contains only 26 red cards (13 hearts and 13 diamonds), out of which 13 are hearts. Therefore, the conditional probability of drawing a heart given that we drew a red card becomes 13/26.
The Independence Theorem
The independence theorem provides a valuable tool for determining if two events are independent or not. It states that two events, A and B, are independent if the conditional probability of A occurring given that B has occurred is the same as the unconditional probability of A occurring:
P(A|B) = P(A)
If this equation holds true, we can conclude that the two events are independent.
In our card-drawing example, let’s examine the independence theorem. The unconditional probability of drawing a heart is 13/52, and the conditional probability of drawing a heart given that we drew a red card is also 13/52. Since these probabilities are equal, we can deduce that drawing a heart and drawing a red card are independent events.
Determining Independence Using Conditional Probability: A Step-by-Step Guide
Understanding the relationship between two variables is crucial in various fields. Determining independence, where one variable does not influence the other, is essential for making informed decisions. Conditional probability offers a powerful tool to assess independence.
Step 1: Define the Variables and Conditional Probabilities
Clearly define the two variables, X and Y, under consideration. Calculate the conditional probability of X given Y as follows:
P(X | Y) = P(X and Y) / P(Y)
Step 2: Check for Equality of Conditional Probabilities
If P(X | Y) is equal to P(X) for all values of Y, then X is independent of Y. In other words, the probability of X (occurrence or non-occurrence) does not depend on the occurrence or non-occurrence of Y.
Example: Coin Toss
Consider a coin toss where X represents the outcome of the first toss (head or tail) and Y represents the outcome of the second toss. If the coin is fair, then:
- P(X = Head | Y = Head) = P(X = Head)
- P(X = Head | Y = Tail) = P(X = Head)
- P(X = Tail | Y = Head) = P(X = Tail)
- P(X = Tail | Y = Tail) = P(X = Tail)
Therefore, X and Y are independent events.
Determining independence using conditional probability is a valuable technique. By following these steps and verifying the equality of conditional probabilities, you can establish whether the occurrence or non-occurrence of one variable influences the other or if they occur independently of each other. This understanding empowers informed decision-making and accurate conclusions.