Unveiling The Secrets Of Cumulative Percentage: A Comprehensive Guide For Data-Driven Insights
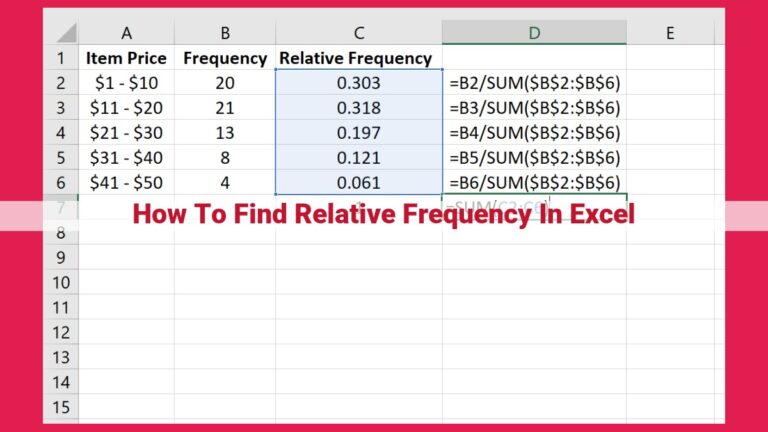
To find the cumulative percentage: Understand its definition and relation to percentages. Calculate it using the formula by summating the values and dividing by the total, tracking them in lists. Analyze the cumulative percentage to identify trends, compare against benchmarks, and discover thresholds. Interpret it to recognize patterns, establish analysis thresholds, and relate milestones to events. Apply it in fields such as finance, statistics, data analysis, and business intelligence for asset monitoring, data distribution analysis, trend identification, and performance assessments.
Understanding Cumulative Percentage
- Definition of cumulative percentage and its relation to percentages
- Relationship with running totals, sums, and distribution
Understanding Cumulative Percentage: Unraveling the Power of Accumulated Data
Cumulative percentage, an indispensable tool in statistical analysis, holds the key to unlocking insights hidden within data. It offers a unique perspective by accumulating individual percentages into a running total, providing a comprehensive measure of distribution and change over time.
At its core, cumulative percentage refers to the total percentage up to a specific point in a dataset. Unlike regular percentages, which represent a part of a whole, cumulative percentages add up to 100% when the entire dataset is considered. They serve as a running tally, tracking the accumulation of data from the beginning to the desired point.
Moreover, cumulative percentages have an intimate relationship with running totals and sums. The running total represents the sum of all values up to a particular point, while the cumulative percentage expresses that running total as a percentage of the overall sum. This interplay provides a powerful mechanism for analyzing trends and patterns in data.
By understanding cumulative percentage, we can effectively capture the distribution of data. It enables us to identify the accumulation rate, locate outliers, and uncover thresholds within the dataset. These insights are invaluable for making informed decisions based on data.
Calculating Cumulative Percentage: A Comprehensive Guide
In the realm of data analysis, cumulative percentage plays a crucial role in understanding the evolution of a data set over time. Whether you’re tracking financial returns, assessing data distribution, or identifying trends, this powerful metric provides valuable insights into the dynamics of your data.
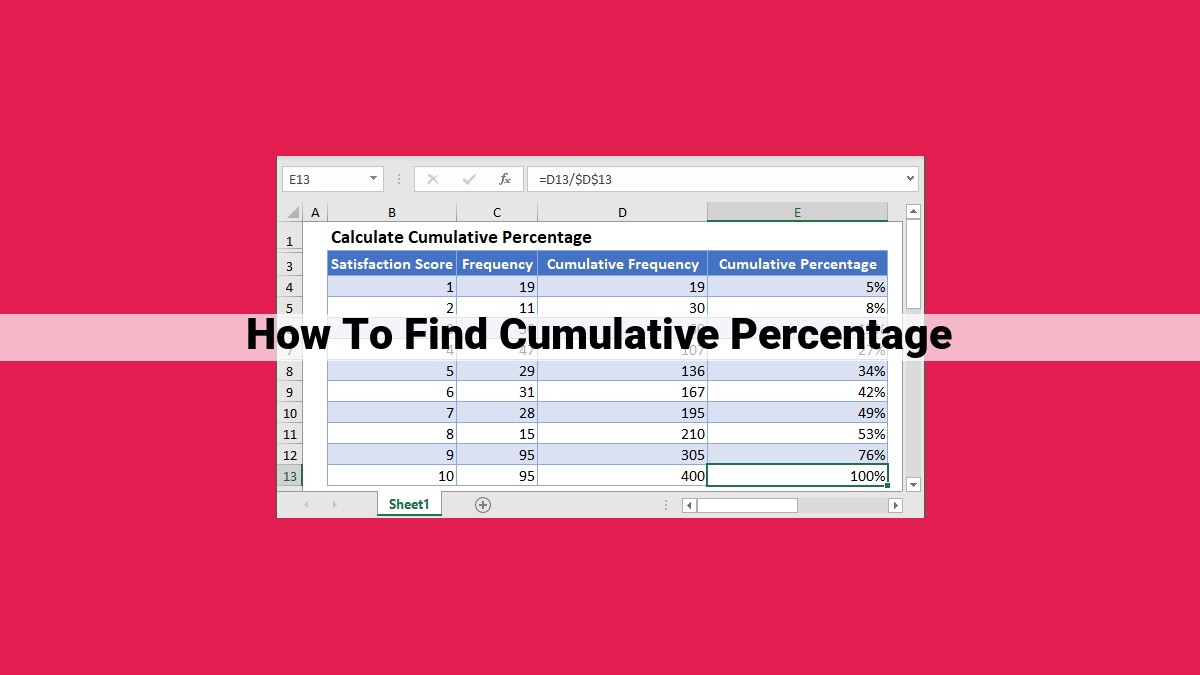
To calculate cumulative percentage, we follow a simple formula:
Cumulative Percentage = (Running Total / Total Sum) * 100%
Consider this example:
You have a list of sales figures for a product over several months:
January: $10,000
February: $12,000
March: $15,000
April: $18,000
May: $20,000
1. To calculate the cumulative percentage for January, we divide the running total (i.e., $10,000) by the total sum (i.e., $95,000) and multiply by 100%:
- Cumulative Percentage for January = ($10,000 / $95,000) * 100% = 10.53%
2. For February, we add the current month’s sales to the running total ($10,000 + $12,000 = $22,000) and divide it by the updated total sum ($95,000 + $12,000 = $107,000):
- Cumulative Percentage for February = ($22,000 / $107,000) * 100% = 20.56%
3. We continue this process for each month, adding new values to the running total and recalculating the cumulative percentage.
Using a list to track the running totals and cumulative percentages can help you stay organized and ensure accuracy:
Month | Running Total | Cumulative Percentage
-------|-----------|--------------------
January | $10,000 | 10.53%
February | $22,000 | 20.56%
March | $37,000 | 38.95%
April | $55,000 | 57.89%
May | $75,000 | 78.95%
By using the cumulative percentage, you can easily identify trends and patterns in your data, measure performance against targets, and make informed decisions based on data-driven insights.
Using Cumulative Percentage for Insightful Analysis
Tracking Trends Over Time: Unveiling Patterns and Insights
Cumulative percentage empowers you to monitor trends over time, enabling you to identify patterns in your data. By visualizing the evolution of your data over multiple time periods, you can spot trends that might not be apparent from individual data points. This helps you make informed decisions based on trends that emerge from your data.
Benchmark and Target Comparisons: Measuring Success and Identifying Gaps
Cumulative percentage allows you to compare your data against industry benchmarks or internal targets. This comparison can highlight areas where you are performing well or falling short. By benchmarking your performance against others, you can set realistic goals, identify areas for improvement, and make data-driven decisions to enhance your performance.
Discovering Thresholds and Milestones: Spotting Critical Points in Data
Cumulative percentage helps you discover thresholds and milestones in your data. These thresholds represent significant points that can trigger actions or indicate changes in your business or organization. By identifying these milestones, you can proactively prepare for upcoming events, capitalize on opportunities, or address potential challenges. Cumulative percentage analysis allows you to stay ahead of the curve by providing valuable insights into critical points in your data.
Interpreting Cumulative Percentage
To make sense of the story told by your data, delve into interpreting cumulative percentages. By examining trends, establishing thresholds, and connecting milestones to relevant events, you unlock valuable insights.
Identifying Trends and Patterns
Cumulative percentages reveal trends over time. Analyze changes in the slope of the cumulative percentage line to identify areas of growth, decline, or plateaus. Patterns may also emerge, such as seasonality if the data shows regular fluctuations over shorter periods.
Establishing Thresholds for Analysis and Decision-Making
Set thresholds to guide your analysis. A threshold is a predetermined value that triggers a specific action or decision. For instance, you could establish a 50% cumulative percentage threshold to indicate a halfway point or target. Exceeding or falling below this threshold may necessitate further investigation or corrective actions.
Relating Milestones to Relevant Events or Changes
Cumulative percentages can serve as milestones that correspond to significant events or changes in your data. For example, a 75% cumulative percentage may represent an important revenue achievement or the completion of a project phase. By relating milestones to specific events, you can gain a deeper understanding of what drives the data and make informed decisions.
Applications of Cumulative Percentage: Unlocking Valuable Insights
Cumulative percentage, a powerful tool for data analysis, offers a wealth of applications across various fields, enabling professionals to extract meaningful insights from their data.
Financial Analysis
In the world of finance, cumulative percentage plays a crucial role in monitoring financial health and performance. By tracking the cumulative growth of assets over time, investors can assess the overall trend and volatility of their investments. Similarly, by calculating the cumulative yield on investments, financial analysts can evaluate their returns and make informed decisions.
Statistical Analysis
Cumulative percentage is indispensable in statistical analysis. It helps uncover the distribution of data, providing valuable information about the spread and outliers. By calculating the cumulative frequency of observations, researchers can identify the median, quartiles, and other percentiles, offering insights into the overall shape and characteristics of the data.
Data Analysis
Data analysts rely on cumulative percentages to uncover trends and identify patterns hidden within data. By plotting cumulative percentage graphs, they can visualize the progression of events or metrics over time, revealing potential growth areas or areas of concern. By comparing cumulative percentages across different groups or variables, analysts can make informed decisions and draw meaningful conclusions.
Business Intelligence
In business intelligence, cumulative percentage is a key metric for assessing performance and making data-driven decisions. By tracking the cumulative sales of a product or service, businesses can identify periods of growth and decline, evaluate marketing campaigns, and forecast future demand. By comparing cumulative market share with competitors, businesses can assess their competitive position and make strategic adjustments to improve profitability.