Unlocking Data’s Potential: A Comprehensive Guide To Descriptive And Inferential Statistics
Statistics, the science of data analysis, encompasses two main branches. Descriptive statistics summarizes and presents data using measures of central tendency and variability, displayed graphically in histograms or box plots. Inferential statistics makes inferences about a population based on a sample, utilizing hypothesis testing, confidence intervals, and regression analysis to draw conclusions and predict outcomes. Combining these branches provides comprehensive data analysis, enabling researchers to understand, interpret, and draw meaningful insights from complex datasets.
Understanding Statistics: A Journey into the Realm of Data Analysis
In the realm of data, where patterns and insights reside, statistics emerges as a guiding force. It illuminates the hidden truths concealed within vast troves of information, empowering us to make sense of the complexities that surround us.
What is Statistics?
Imagine statistics as the master architect of data analysis, meticulously constructing a blueprint that deciphers the secrets of our world. It weaves together the threads of mathematics and real-world applications, unlocking the potential for groundbreaking discoveries in fields as diverse as medicine, finance, and even sports.
Like a seasoned detective, statistics uncovers the patterns hidden beneath the surface of data, shedding light on relationships and trends that would otherwise remain invisible to the naked eye. It grants us the power to predict future outcomes, draw informed conclusions, and make data-driven decisions that shape the course of our lives.
Main Branches of Statistics: Unveiling the Power of Data
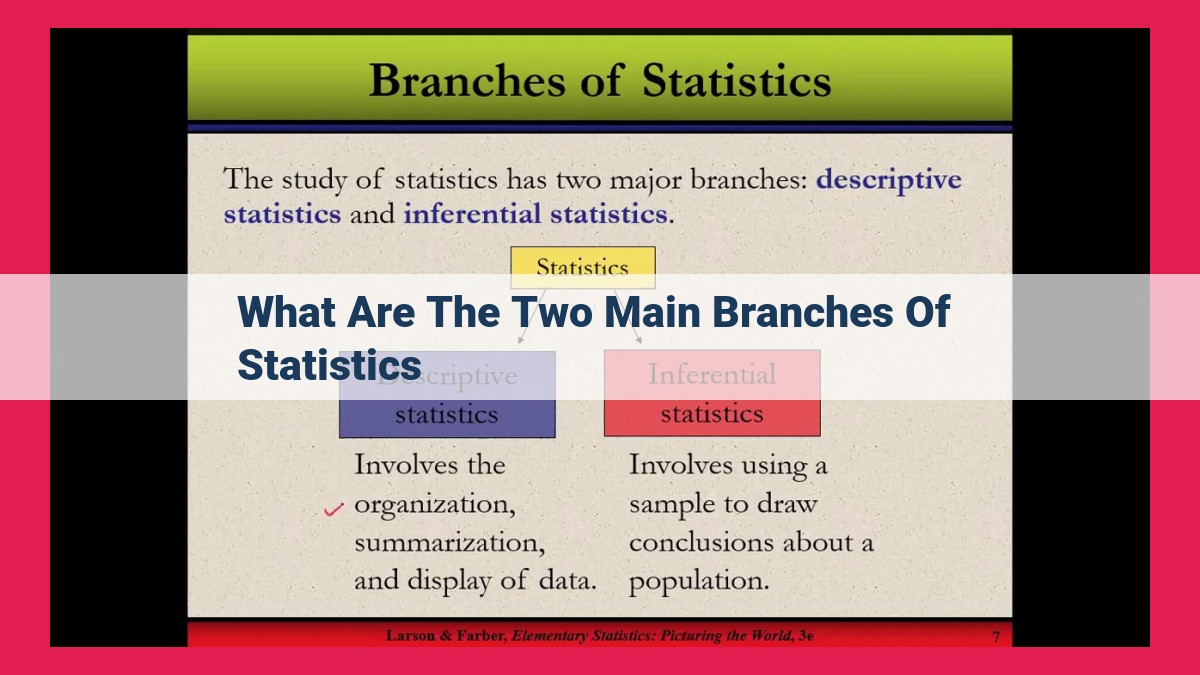
Statistics, the science of data analysis, empowers researchers and professionals across diverse fields to extract meaningful insights from raw data. To effectively navigate this complex discipline, it’s essential to understand its two primary branches: descriptive statistics and inferential statistics.
Descriptive Statistics: Painting a Clear Picture
Descriptive statistics provides the foundation for understanding data by summarizing and presenting it in a comprehensible manner. Key measures such as mean (average), median (middle value), and mode (most frequent value) provide valuable information about a dataset’s central tendency. Additionally, measures of variability (range, variance, and standard deviation) describe how data spreads around the mean. These statistics lay the groundwork for creating informative graphical representations like histograms, scatterplots, and box plots that visually depict data distributions and relationships.
Inferential statistics takes data analysis a step further, allowing researchers to make inferences about a larger population based on a smaller sample. Through hypothesis testing, they formulate hypotheses and collect data to support or reject them. Confidence intervals provide estimates of population parameters, while regression analysis helps predict dependent variable values based on independent variables. These techniques enable researchers to draw informed conclusions from limited data, extending their insights beyond the immediate sample.
The Dance of Descriptive and Inferential Statistics
Descriptive and inferential statistics complement each other seamlessly, offering a comprehensive approach to data analysis. Descriptive statistics establishes the basic characteristics of a dataset, while inferential statistics allows researchers to make broader generalizations and draw conclusions. This combination empowers data analysts to tell complete stories about their data, uncovering hidden patterns and insights that drive informed decision-making and knowledge generation.
Descriptive Statistics: Unveiling the Essence of Your Data
In the vast world of data, descriptive statistics emerges as a guiding light, illuminating the path to understanding and capturing the essence of your data. Its primary objective is to summarize and present data in a meaningful way, transforming raw numbers into valuable insights.
Descriptive statistics offers a versatile toolkit to unravel the central tendency of your data, revealing the typical or average values. The mean, median, and mode are powerful measures that provide a snapshot of data distribution. Mean, or average, represents the sum of all values divided by the number of observations. Median, on the other hand, is the middle value when the data is arranged in ascending order. Mode, a less common measure, indicates the value that occurs most frequently.
Understanding data variability is equally crucial. Descriptive statistics equips you with metrics such as range, variance, and standard deviation to assess how data values spread out. Range, the difference between the highest and lowest values, provides a basic understanding of data dispersion. Variance and standard deviation, more refined measures, quantify the average distance of data points from the mean.
Graphical representations play an indispensable role in showcasing data distributions. Histograms depict the frequency of data values within specified intervals, while scatterplots reveal relationships between two variables. Box plots compactly summarize data by displaying the median, quartiles, and potential outliers.
By harnessing the power of descriptive statistics, you can uncover valuable insights hidden within your data. It helps you identify patterns, summarize key characteristics, and make informed decisions based on objective evidence. Whether you’re a data scientist, business analyst, or simply curious about the world around you, descriptive statistics empowers you with the ability to make sense of data and derive meaningful conclusions.
Inferential Statistics: Unveiling the Secrets of Data
In the realm of data analysis, inferential statistics emerges as a powerful tool, allowing us to uncover hidden patterns and make informed predictions beyond the confines of the data we directly observe. Unlike descriptive statistics, which merely presents a snapshot of the data at hand, inferential statistics takes a bold leap into the unknown, making inferences about the larger population from which our sample was drawn.
Hypothesis Testing: The Art of Conjecture and Verification
Hypothesis testing, the cornerstone of inferential statistics, embarks on an intellectual journey to challenge our assumptions about the data. We begin by formulating a hypothesis, a tentative statement about the population that we aim to either support or reject. Armed with our hypothesis, we gather a random sample from the population and meticulously analyze its characteristics.
Through statistical calculations, we determine the probability of obtaining our sample results, assuming the truth of our hypothesis. If this probability, known as the p-value, falls below a predetermined threshold, we cast doubt upon our hypothesis, suggesting that our sample’s behavior is unlikely to have occurred under its assumed truth. This leads us to reject the hypothesis. Conversely, when the p-value exceeds the threshold, we lend credence to our hypothesis, failing to reject it.
Confidence Intervals: Embracing Uncertainty with Precision
While hypothesis testing provides a binary outcome, confidence intervals offer a more nuanced view of our inferences. Confidence intervals estimate the range within which the true population parameter (such as the mean or proportion) is likely to lie, with a specified level of confidence. This range accounts for the inherent uncertainty associated with drawing conclusions from a sample, allowing us to make more precise predictions about the population.
Regression Analysis: Predicting the Future with Confidence
Regression analysis, a versatile tool in inferential statistics, unveils the intricate relationships between variables. By studying the interplay between an independent variable (e.g., advertising spending) and a dependent variable (e.g., sales revenue), we can develop models that predict the future value of the dependent variable based on changes in the independent variable. This predictive power empowers businesses, policymakers, and researchers alike to make informed decisions and optimize outcomes.
The Symphony of Inferential Statistics
Descriptive and inferential statistics, though distinct in their approaches, form a harmonious symphony in data analysis. Descriptive statistics provides the foundation, summarizing and presenting the data, while inferential statistics ascends beyond the data, drawing inferences and unlocking deeper insights. Together, they paint a comprehensive picture of the data, empowering us to make evidence-based decisions and unveil the mysteries that lie within the vast sea of information.
Bridging the Gap: Combining Descriptive and Inferential Statistics for Powerful Data Insights
As we navigate the vast sea of data that surrounds us, statistics serves as our compass, guiding us towards meaningful insights and informed decisions. While descriptive and inferential statistics may seem like separate entities, their harmonious union empowers us with a comprehensive understanding of data.
Descriptive statistics, the able navigator of data details, provides a snapshot of what is. It condenses complex datasets into manageable summaries, painting a clear picture of central tendencies and variations. Through measures like mean, median, mode, and standard deviation, it unpacks patterns, trends, and relationships within the data.
Inferential statistics, on the other hand, ventures beyond the confines of the data at hand. It empowers us to make educated guesses about a broader population, using a carefully selected sample as our guide. Through hypothesis testing and confidence intervals, it allows us to draw conclusions and make predictions with a certain level of certainty.
Uniting these two branches unveils the true power of statistical analysis. Descriptive statistics provides the foundation upon which inferential statistics builds its inferences. Imagine a detective investigating a crime scene; descriptive statistics analyzes the physical evidence, while inferential statistics draws conclusions about the potential culprit.
Furthermore, by combining these statistical approaches, we gain holistic insights that neither can provide alone. For instance, descriptive statistics may reveal a high average income in a particular region. However, inferential statistics can delve deeper, telling us if this observation is statistically significant or merely a random fluctuation.
In essence, descriptive and inferential statistics are two sides of the same coin, offering a complete view of data. They work together to provide a comprehensive understanding of data, allowing us to make more informed decisions, draw meaningful conclusions, and navigate the complex world of information with confidence.
