Understanding Tolerance Ranges: Ensuring Product Quality And Process Optimization

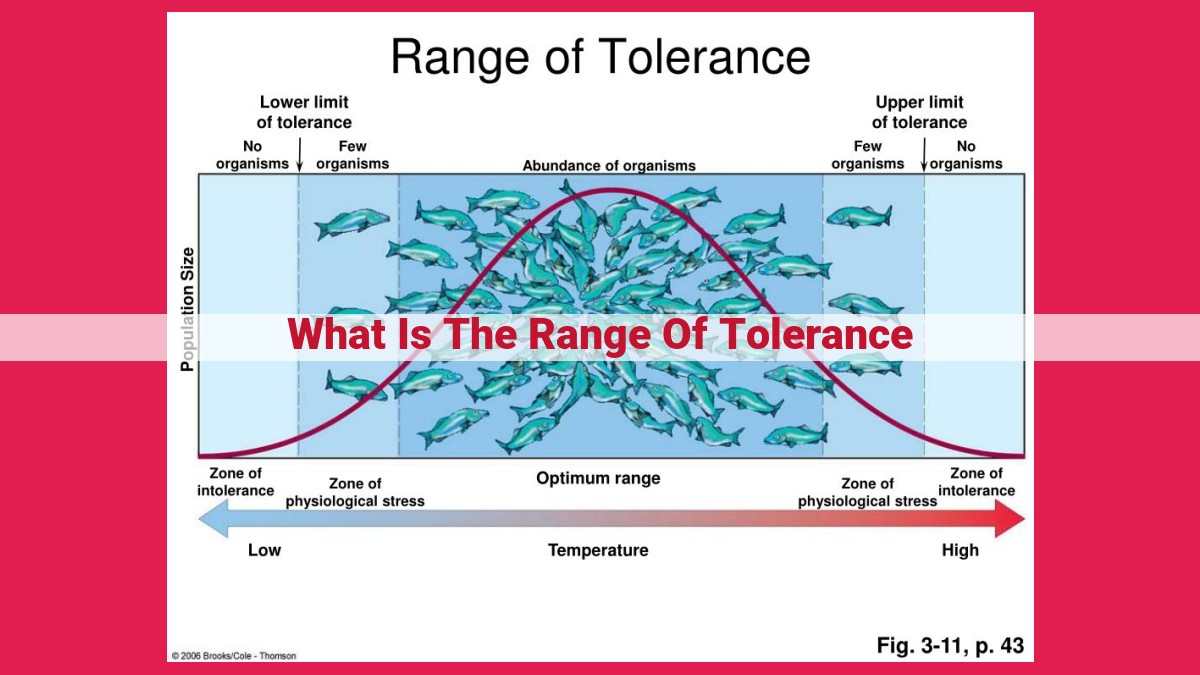
The range of tolerance specifies an acceptable interval of values for a given product or process. It defines the limits within which a characteristic can vary without affecting performance or quality. The lower limit represents the minimum acceptable value, while the upper limit sets the maximum. The range of tolerance helps ensure product acceptability, improves processes, and serves as a benchmark for quality control. By monitoring variations and analyzing cause-and-effect relationships, manufacturers can adjust processes to meet specifications and enhance overall quality.
Understanding the Range of Tolerance: Key to Product Acceptability
In the world of manufacturing, ensuring product acceptability is paramount. One crucial concept in this regard is the range of tolerance, which defines the acceptable interval of values for a product’s characteristics. This range serves as a benchmark against which products are measured, guaranteeing their compliance with specifications and enhancing process improvement.
The range of tolerance establishes the lower limit, the minimum acceptable value, and the upper limit, the maximum acceptable value. These limits are crucial in determining whether a product meets the desired quality standards. Deviations outside these limits indicate potential problems that need to be diagnosed and addressed. Statistical tools like scatter diagrams and cause-and-effect diagrams aid in visualizing and analyzing these deviations.
Related Concepts: Lower and Upper Limits
- Explanation of lower limit as the minimum acceptable value.
- Explanation of upper limit as the maximum acceptable value.
- Use of scatter diagrams and cause-and-effect diagrams to illustrate and diagnose deviations.
Related Concepts: Lower and Upper Limits
Understanding the range of tolerance requires a clear grasp of its lower and upper limits. The lower limit is the acceptable minimum value, often driven by engineering specifications or functional requirements. It ensures that products meet the intended performance or safety standards.
The upper limit, on the other hand, represents the maximum acceptable value. It ensures that products do not exceed predefined limits, such as those related to durability or quality. In manufacturing and quality control, these limits serve as boundaries within which product values are considered acceptable.
Visualizing Deviations with Scatter Diagrams and Cause-and-Effect Diagrams
Scatter diagrams and cause-and-effect diagrams are valuable tools for illustrating and diagnosing deviations from the range of tolerance. Scatter diagrams plot data points representing product values, allowing for easy identification of outliers and trends. They can reveal patterns that indicate underlying causes of variation.
Cause-and-effect diagrams, also known as fishbone diagrams, help identify potential factors that may contribute to deviations. By brainstorming and organizing these factors into categories (e.g., materials, methods, machines), manufacturers can systematically analyze and eliminate root causes of variability.
By understanding lower and upper limits and using visual tools such as scatter diagrams and cause-and-effect diagrams, manufacturers can effectively monitor and improve processes to meet the desired range of tolerance. This, in turn, ensures product quality, customer satisfaction, and adherence to industry standards.
Applications of the Range of Tolerance
In the realm of manufacturing and quality control, the range of tolerance reigns supreme as the gatekeeper of product acceptability. By establishing acceptable intervals for product dimensions and characteristics, manufacturers can ensure that their products meet customer expectations and industry specifications.
Moreover, the range of tolerance serves as a powerful tool in monitoring and improving processes. By identifying deviations from the acceptable limits, manufacturers can pinpoint sources of variation and take corrective actions to enhance process efficiency. Through the use of scatter diagrams and cause-and-effect diagrams, variations can be visualized and analyzed to detect patterns and root causes.
In the world of quality control, the range of tolerance plays a pivotal role in statistical process control (SPC). It forms the bedrock for setting control limits, which are used to monitor the stability of processes over time. By detecting sources of variation and ensuring product quality, the range of tolerance helps manufacturers maintain a high level of customer satisfaction and adherence to industry standards.
Determining the Range of Tolerance
When establishing the range of tolerance, several pivotal factors come into play:
-
Engineering Specifications and Customer Requirements: These blueprints define the minimum and maximum acceptable values, ensuring the product meets its intended functionality and quality standards.
-
Historical Data: If available, historical data can provide valuable insights into the natural variation of the process. By analyzing past performance, manufacturers can gain a better understanding of the tolerable limits that maintain product acceptability.
Statistical Techniques: Statistical analysis plays a crucial role in determining the range of tolerance.
-
Standard Deviation: Calculating the standard deviation helps quantify the spread of the data. A smaller standard deviation indicates a narrower range of variation, allowing for tighter tolerance limits.
-
Process Capability Analysis (PCA): PCA assesses the ability of a process to meet specified tolerances. It compares the process variation to the tolerance range, ensuring the process is capable of producing products within the acceptable limits.
Storytelling:
Imagine you’re a manufacturer of high-precision components. Your customers demand products within exact dimensions for their crucial applications. To determine the appropriate range of tolerance, you meticulously analyze the engineering specifications and historical data.
You employ statistical techniques like standard deviation and PCA. The results reveal a relatively small standard deviation, indicating a tightly controlled process. The PCA also confirms that the process is capable of meeting customer requirements.
Armed with this knowledge, you establish a range of tolerance that allows for a slight margin of variation, ensuring your components consistently meet the desired specifications while minimizing defects and rejections. Your customers are satisfied, knowing that your components meet their exacting standards.