Understanding The Domain Of A Relation: Essential For Graphing And Mathematics

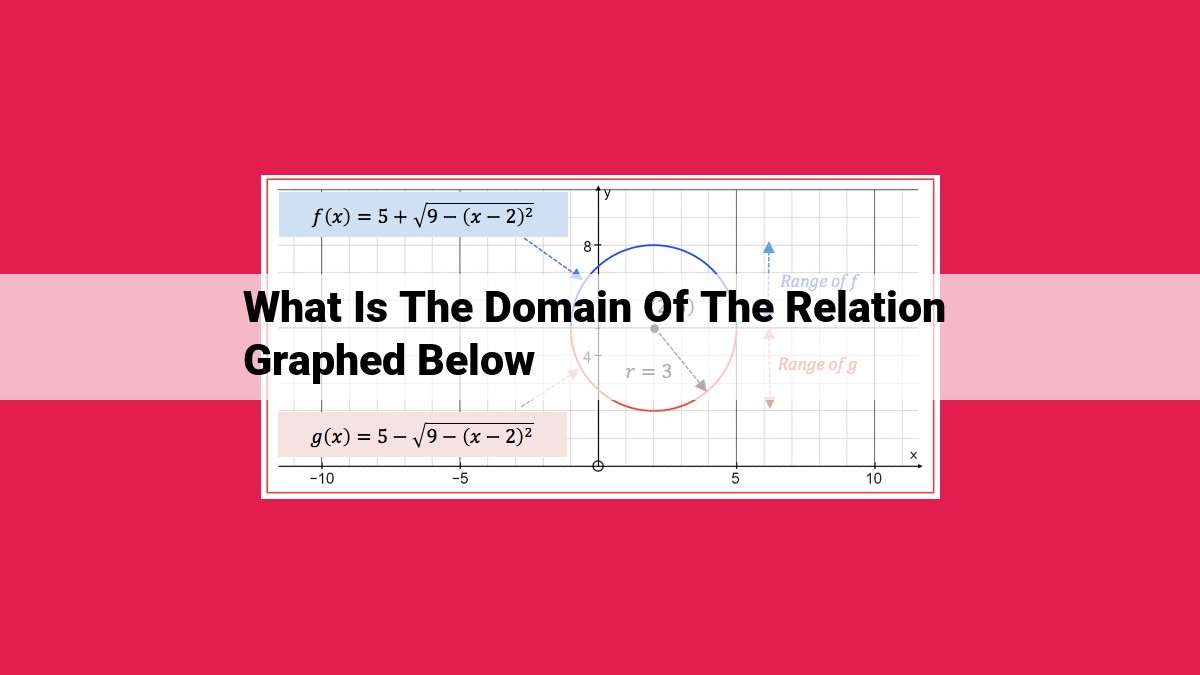
The domain of a relation is the set of all independent variables, which are graphed on the horizontal (x) axis. In the given graph, the independent variable ranges from x = -3 to x = 5. Therefore, the domain of the relation is all values of x such that -3 ≤ x ≤ 5.
Unraveling the World of Relations: A Beginner’s Guide
In the realm of mathematics, relations play a pivotal role in representing connections between two sets of objects. Think of a relation as a special club where elements from one set (called the domain) are paired with elements from another set (called the range).
To visualize these relationships, we rely on the trusty graph. Imagine a Cartesian plane, a two-dimensional grid marked by perpendicular axes. The x-axis houses the independent variable, which is the variable you can control or change. The y-axis, on the other hand, holds the dependent variable, which responds to changes in the independent variable.
Each pair of values (one from the domain and one from the range) forms an ordered pair. Think of it as a dynamic duo, denoted by (x, y), that pinpoints a unique location on the graph. These ordered pairs are essential in mapping out the relation’s behavior.
So, if you’re looking to decode the mysteries of relations, understanding the concepts of domain, range, graph, and ordered pairs is the key. These building blocks will empower you to decipher and analyze these mathematical connections with ease.
Concepts and Definitions
In mathematics, a relation is a connection between two sets, where each element of the first set corresponds to one or more elements of the second set. These sets are referred to as the domain and range of the relation.
Domain and Range
The domain of a relation is the set of all possible values for the independent variable. This is typically represented on the x-axis of a graph. The range is the set of all possible values for the dependent variable, which is typically represented on the y-axis.
Graph of a Relation
A relation can be visually represented using a graph. This is a diagram on the Cartesian plane, which consists of two perpendicular axes. The domain values are plotted along the x-axis, and the range values are plotted along the y-axis.
Ordered Pair
Each point on the graph is represented by an ordered pair. An ordered pair is a set of two numbers, written in the form *(x, y)_. The first number represents the x-coordinate, which corresponds to the domain value. The second number represents the y-coordinate, which corresponds to the range value.
By understanding these concepts, you can effectively interpret and analyze relations, which are used extensively in mathematics and other fields.
Applying the Concepts: Unveiling the Domain through Graph Analysis
Now, let’s dive into a real-world example to solidify our understanding. Imagine you’re presented with a captivating graph, its lines and curves dancing across the Cartesian plane. Your mission is to tease out the hidden secrets within this visual masterpiece.
First, scrutinize the graph’s x-axis. This axis holds the key to identifying the independent variable—the one that stands alone, dictating the changes we see. As you trace your finger along the x-axis, you’ll encounter a series of values. These values represent the possible inputs for our relation, forming the domain.
In our graph, let’s say the x-axis displays a range of numbers from -5 to 5. These numbers constitute the domain of our relation. Each number represents a potential starting point for our function, a place from which the dependent variable will emerge.