Understanding Cumulative Percentage: A Comprehensive Guide For Data Analysis And Decision-Making
To compute cumulative percentage, begin by finding the total value within a dataset. Then, accumulate values up to a specific point in time to calculate the cumulative total. Divide the cumulative total by the total value to obtain the cumulative percentage. The percentage increase, reflecting changes over time, is the difference in cumulative percentages over a specific period. Cumulative percentage finds applications in various fields, including finance, sales, and marketing. It is closely associated with total, cumulative total, and percentage increase, forming a foundation for data analysis and decision-making.
Understanding the Essence of Cumulative Percentage: Unveiling the Power of Data
In the labyrinth of data analysis, cumulative percentage emerges as a beacon of clarity, guiding us through the complexities of understanding change over time. It offers a potent tool to dissect patterns, gauge progress, and draw insightful conclusions from seemingly overwhelming datasets.
Nestled at the heart of cumulative percentage lies the concept of aggregating values over a specified interval or period. By summing up individual data points, we create a cumulative total, which paints a comprehensive picture of the data’s trajectory. Dividing this cumulative total by the total value in the dataset, we arrive at the cumulative percentage.
This percentage provides a potent measure of relative change, reflecting the proportion of the total value achieved or exceeded at a given point in time. It empowers us to track progress towards targets, identify trends, and make informed decisions based on data-driven insights.
Cumulative percentage finds its application in a myriad of fields, from finance to sales and marketing. It enables financial analysts to monitor portfolio growth, sales teams to gauge market penetration, and marketing professionals to evaluate campaign effectiveness. Its versatility extends to supply chain management, project management, and even medical research.
By unraveling the intricate world of cumulative percentage, we unlock a powerful tool for data interpretation and analysis. It empowers us to make sense of complex datasets, identify key trends, and make informed decisions that drive success in various spheres.
The Importance of Calculating Total Value: A Baseline for Cumulative Percentage
In the realm of data analysis, understanding the concept of cumulative percentage is crucial. It provides valuable insights into the growth and trends within a dataset. At the heart of cumulative percentage lies the concept of total value, which serves as the foundation for all calculations.
The total value represents the sum of all values in a dataset. It provides a reference point against which cumulative percentages can be compared. Without establishing this baseline, it becomes impossible to determine the relative magnitude of cumulative changes.
Calculating the total value is a critical step in data analysis because it:
-
Provides a context for understanding: The total value establishes a reference point for interpreting cumulative percentages. It allows you to gauge the relative significance of changes over time.
-
Ensures accuracy: By calculating the total value up front, you minimize the risk of errors in subsequent calculations.
-
Facilitates comparisons: The total value enables you to compare datasets of different sizes and units. By expressing cumulative percentages as a proportion of the total value, you can make meaningful comparisons.
Before embarking on cumulative percentage calculations, it is imperative to ensure that you have accurately calculated the total value of the dataset. This will lay the groundwork for accurate and meaningful analysis, allowing you to uncover valuable insights and make informed decisions.
Determining Cumulative Total
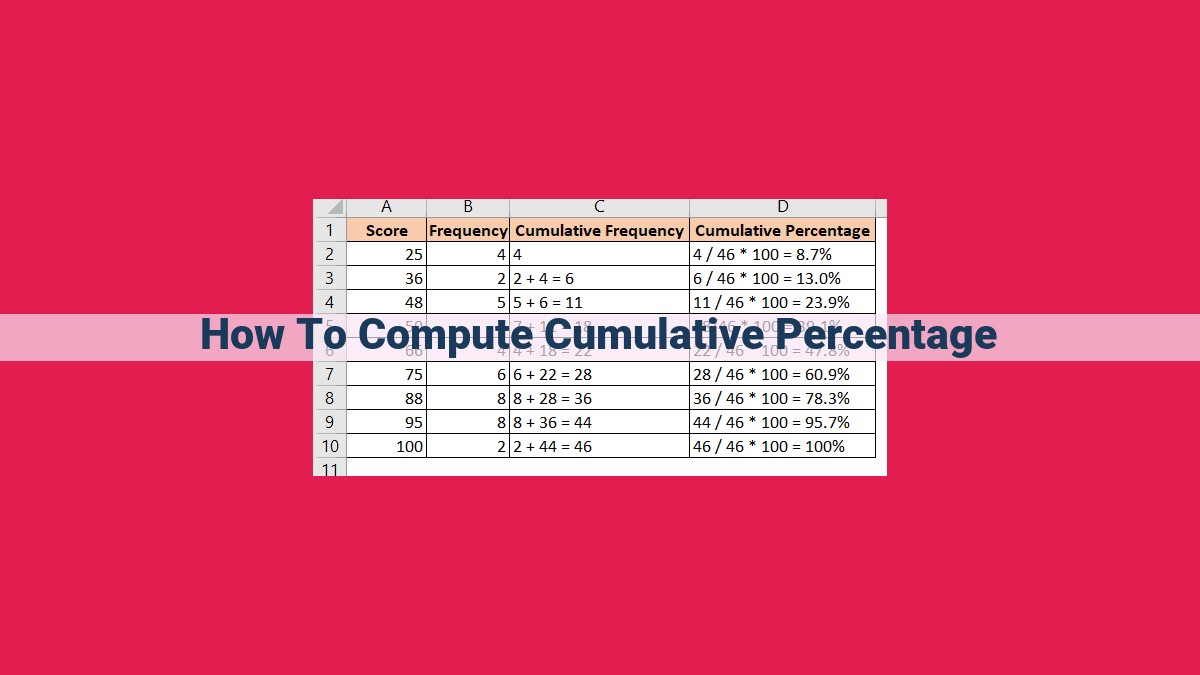
The cumulative total is the sum of all values up to a specific point in time. It’s a crucial step in calculating cumulative percentage. To determine the cumulative total, you simply add up the values in sequence.
Imagine you’re tracking sales for a month. At the end of the first week, you’ve sold $1,000. At the end of the second week, you’ve sold $2,000. To calculate the cumulative total for the first two weeks, you would add $1,000 + $2,000 = $3,000.
This cumulative total is not only the total value of sales up to that point but also serves as the baseline against which cumulative percentages are calculated. It provides a reference point for assessing progress and comparing different periods.
Computing Cumulative Percentage: A Step-by-Step Guide
In the realm of data analysis, the cumulative percentage plays a pivotal role in understanding the evolution and trends within a dataset. Let’s delve into the process of computing this indispensable metric.
Step 1: Calculate Total Value
The cumulative percentage is a measure of the progression of values over time, relative to the total value. To establish this baseline, it’s essential to calculate the total value of the dataset. Simply sum up all the values to obtain this crucial number.
Step 2: Determine Cumulative Total
With the total value in hand, we commence accumulating values incrementally up to a specific point in time. Each cumulative total represents the sum of values from the beginning of the dataset to that particular point.
Step 3: Compute Cumulative Percentage
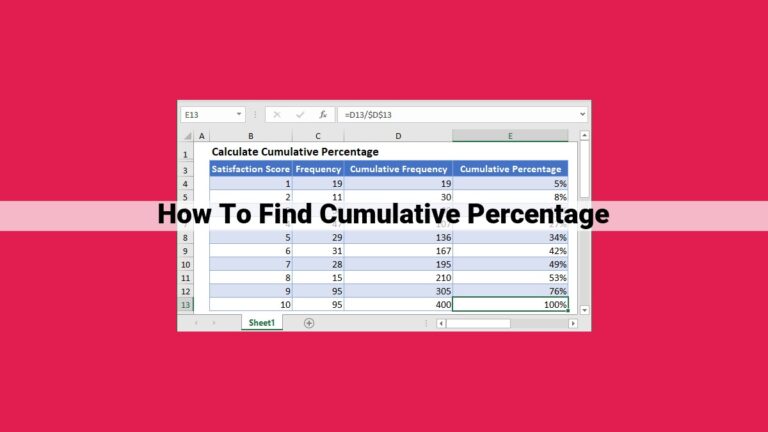
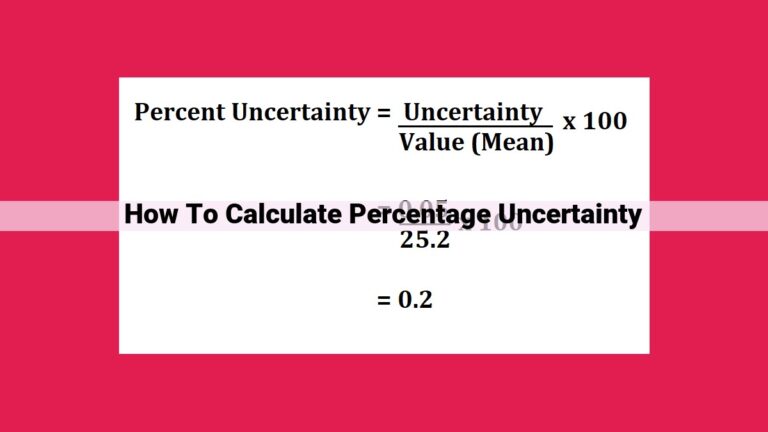
The cumulative percentage is the ratio of the cumulative total to the total value. This calculation provides a standardized measure of progress, allowing for easy comparison of different datasets or time periods.
Formula:
Cumulative Percentage = (Cumulative Total / Total Value) * 100%
Example:
Let’s consider a dataset tracking monthly sales revenue. The total value for the year is $1,000,000. The cumulative total for the first six months is $500,000.
Using the above formula, we can calculate the cumulative percentage for the first half of the year:
Cumulative Percentage = (500,000 / 1,000,000) * 100% = 50%
This result indicates that by mid-year, 50% of the total revenue has been achieved.
Percentage Increase: Measuring Change Over Time
In the realm of data analysis, cumulative percentage provides a powerful tool for measuring change over time. It unveils the incremental growth or decline in a dataset, offering invaluable insights into performance, trends, and overall progress. By delving into the concept of percentage increase, we can unlock the secrets hidden within cumulative percentage.
Understanding Percentage Increase
Percentage increase measures the change in cumulative percentage over a specified period. It quantifies the gain or loss in performance relative to a previous point in time. By comparing current and past cumulative percentages, we can pinpoint the exact magnitude of change and assess its significance.
For instance, if a company reports a cumulative sales increase of 10% in the last quarter compared to the previous one, it means that sales have grown by 10% during that period. Such information enables businesses to monitor their growth trajectory, identify potential challenges, and make data-driven decisions for the future.
Calculating Percentage Increase
To calculate percentage increase, we simply subtract the cumulative percentage at the previous point in time from the current cumulative percentage. This difference represents the absolute change, which is then divided by the previous cumulative percentage to yield the percentage increase.
Practical Applications
Percentage increase finds widespread application in various fields:
- Financial analysis: Measuring the return on investment (ROI) and evaluating the performance of stocks and bonds
- Sales and marketing: Tracking revenue growth, customer acquisition, and marketing campaign effectiveness
- Project management: Monitoring task completion, resource utilization, and project timelines
- Healthcare: Assessing patient outcomes, treatment efficacy, and overall health improvements
Understanding percentage increase empowers us to unravel the dynamic nature of data and quantify change over time. It provides a precise and informative metric for evaluating progress, performance, and trends. By incorporating percentage increase into our data analysis toolbox, we unlock the potential for actionable insights and informed decision-making.
Applications of Cumulative Percentage: Unlocking Valuable Insights in Diverse Fields
Cumulative percentage, a powerful statistical tool, finds its applications in a myriad of fields, empowering professionals to analyze and interpret data effectively. Let’s explore its practical uses in various sectors:
Finance:
In the financial world, cumulative percentage plays a crucial role in:
- Portfolio Performance Evaluation: Tracking the cumulative return or loss of an investment portfolio over time to assess its performance.
- Trend Analysis: Identifying long-term growth or decline patterns in stock prices or market indices.
- Forecasting: Predicting future financial trends based on historical data and cumulative percentage growth rates.
Sales and Marketing:
Cumulative percentage is invaluable in sales and marketing:
- Sales Pipeline Analysis: Monitoring the cumulative percentage of leads moving through the sales pipeline, providing insights into sales performance and conversion rates.
- Customer Segmentation: Dividing customers into segments based on their cumulative purchase history, enabling targeted marketing campaigns.
- Market Share Analysis: Determining the cumulative market share of a product or brand compared to competitors.
Other Applications:
Beyond finance and sales, cumulative percentage finds use in diverse fields:
- Manufacturing: Tracking the cumulative yield of production processes, identifying bottlenecks and improving efficiency.
- Healthcare: Analyzing patient recovery rates by tracking the cumulative percentage of patients achieving milestones in treatment plans.
- Education: Assessing student progress by comparing cumulative percentage scores on assignments and exams.
In each of these applications, cumulative percentage provides a comprehensive view of data trends, allowing professionals to make informed decisions, predict outcomes, and improve performance. By understanding the concept and calculation of cumulative percentage, you can harness its power to unlock valuable insights in your field of expertise.
Understanding the Interrelationships of Total, Cumulative Total, and Percentage Increase
In the realm of data analysis, cumulative percentage plays a crucial role in comprehending trends and patterns within a dataset. To grasp this concept fully, it’s essential to understand the interconnectedness of three key terms: Total, Cumulative Total, and Percentage Increase.
The Total represents the totality of values in a given dataset, serving as the foundation for all cumulative percentage calculations. It provides the benchmark against which other values are measured.
The Cumulative Total is the sum of values accumulated up to a specific point in time or within a defined interval. It reflects the running total as the dataset progresses, capturing the cumulative effect of changes.
Percentage Increase measures the rate of change between two cumulative totals over a specific period. It quantifies the growth or decline in the dataset, expressed as a percentage.
These three concepts are intrinsically linked in the computation of cumulative percentage. The cumulative total is divided by the total to determine the cumulative percentage, while the percentage increase is calculated as the change in cumulative percentage over a specific time frame.
For instance, consider a sales report where the Total sales for a quarter amount to $100,000. The Cumulative Total after the first month might be $25,000, representing 25% of the total. The Percentage Increase from the beginning of the quarter to the end of the month, assuming the cumulative total rises to $50,000, would be 100%, reflecting a doubling of sales.
Comprehending the interrelationships among Total, Cumulative Total, and Percentage Increase is vital for interpreting cumulative percentage analysis effectively. These concepts are indispensable tools for tracking progress, identifying trends, and making informed decisions based on data.