Understand Percent Frequency: A Comprehensive Guide For Data Analysis
Percent frequency helps standardize comparisons across datasets by expressing data as a percentage of the total sample. Calculate it by dividing the frequency of an occurrence by the total sample size and multiplying by 100. Understanding related concepts like frequency, relative frequency, histograms, and bar charts is crucial. Uses include data analysis, summarization, and comparing datasets of varying sizes. Percent frequency has applications in descriptive and inferential statistics, as well as hypothesis testing.
Understanding Percent Frequency: Standardizing Data Comparisons
Imagine you’re exploring two different datasets, each with its unique number of observations. How can you compare the frequency of occurrence of a particular attribute across these datasets? Percent frequency unveils the answer, transforming comparisons into a breeze.
Definition and Purpose of Percent Frequency
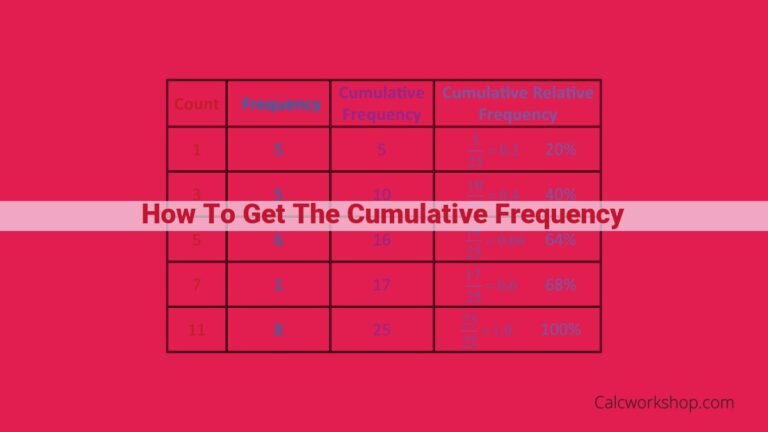
Percent frequency, also known as relative frequency, is a standardized measure that expresses the proportion of occurrences of a value within a dataset. It is calculated as the number of times a value appears in a dataset divided by the total number of observations.
How It Standardizes Comparisons Across Datasets
Raw frequency counts are useful within a dataset, but comparisons become challenging when datasets have varying sample sizes. Percent frequency solves this issue by standardizing counts to a common scale between 0% and 100%. This eliminates the influence of sample size and enables meaningful comparisons across different datasets.
Related Concepts: Frequency, Relative Frequency, Histograms, and Bar Charts
Frequency is the number of times a particular value or event occurs in a dataset. It is the foundation for the other related concepts.
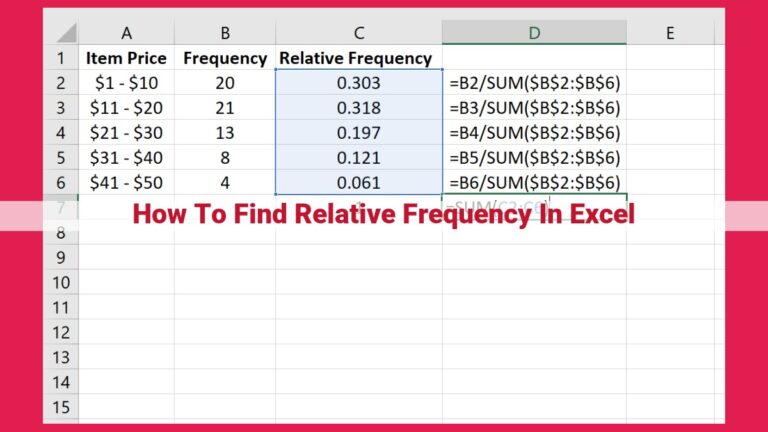
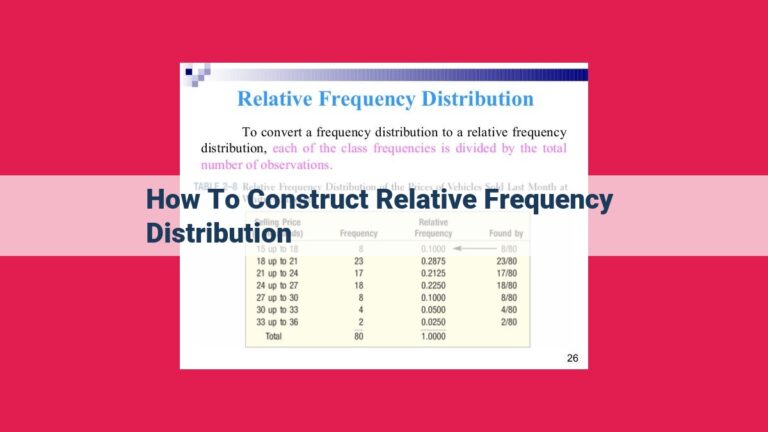
Relative frequency is the proportion of the total number of observations occupied by a particular value or event. It is calculated by dividing the frequency of that value or event by the total number of observations. Percent frequency is simply a relative frequency expressed as a percentage. This standardization allows for quick and easy comparisons across different datasets, regardless of their sizes.
Histograms and bar charts are graphical representations of frequency distributions. Histograms show the frequency of values or events within specific ranges, while bar charts display the frequency of each individual value or event. Both charts help visualize the distribution of data and identify patterns or trends.
In relation to percent frequency, histograms and bar charts provide a visual context. Histograms show how percent frequencies are distributed over the data range, while bar charts clearly show the relative frequencies of different values or events for comparison. By understanding how these concepts interact, one gains a deeper comprehension of data distribution and can make informed inferences.
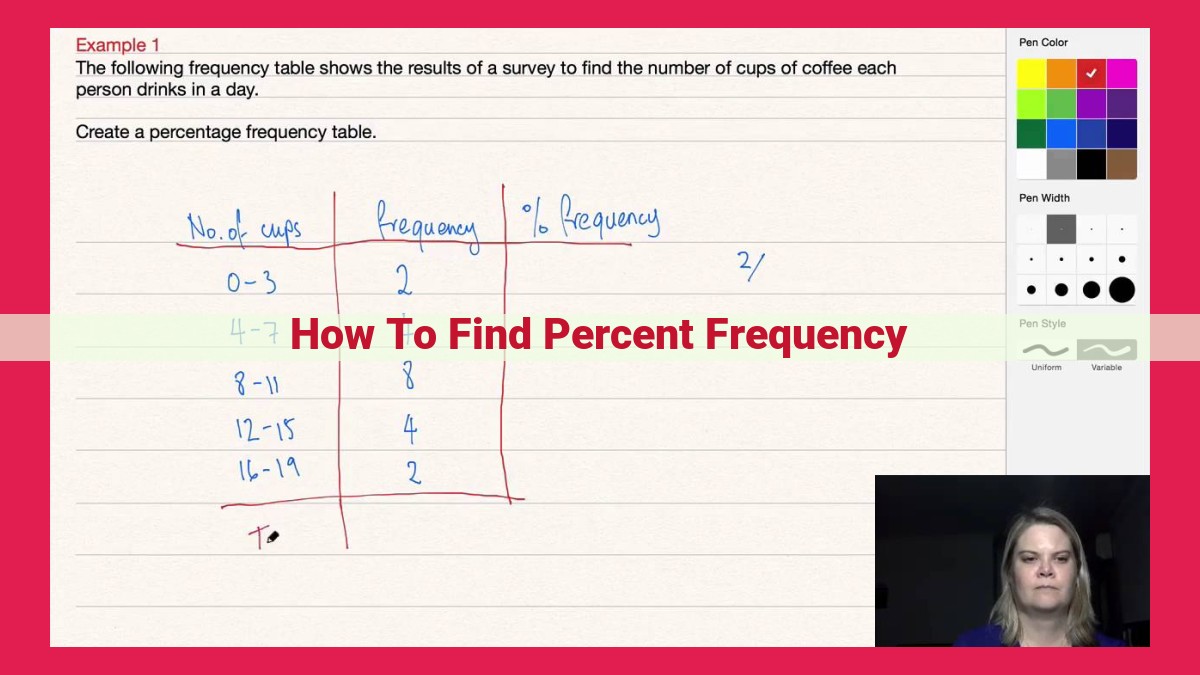
Calculating Percent Frequency: A Step-by-Step Guide
In the realm of data analysis, understanding percent frequency is paramount. It enables us to draw meaningful comparisons and gain insights from seemingly disparate datasets. Delve into the world of statistics, and discover the art of calculating percent frequency.
Formula for Percent Frequency
The formula to calculate percent frequency is simple:
Percent Frequency = (Frequency of Occurrence / Total Number of Observations) x 100
This formula represents the proportion of a given value within a dataset expressed as a percentage. For example, if the value “blue” appears 5 times in a dataset of 20 observations, the percent frequency of “blue” would be:
Percent Frequency = (5 / 20) x 100 = 25%
Step-by-Step Instructions
Calculating percent frequency is a straightforward process. Follow these steps:
- _Count the Frequency of Occurrence: Determine how many times the value you’re interested in appears in the dataset.
- _Find the Total Number of Observations: Count the total number of observations or data points in the dataset.
- _Divide and Multiply: Divide the frequency of occurrence by the total number of observations. Then, multiply the result by 100 to convert it to a percentage.
Example
Let’s calculate the percent frequency of the eye color “brown” in a dataset of 100 individuals:
- Frequency of Brown Eyes: 45
- Total Number of Observations: 100
Using the formula:
Percent Frequency = (45 / 100) x 100 = 45%
Therefore, the percent frequency of brown eyes in the dataset is 45%.
Unlocking the Power of Percent Frequency: Uses in Data Analysis and Beyond
Percent frequency, a fundamental concept in data analysis, empowers us to make sense of complex datasets and draw meaningful conclusions. By expressing the occurrence of an event as a percentage of total observations, we standardize comparisons and gain valuable insights into data patterns.
Data Analysis and Summarization
Percent frequency plays a pivotal role in data summarization, providing a concise and informative representation of data distributions. For instance, suppose we have a dataset of customer ratings for a product. By calculating the percent frequency of each rating category, we can quickly grasp the overall satisfaction level of customers. This information is invaluable for businesses seeking to improve their products or services.
Comparing Datasets of Different Sizes
One of the unique strengths of percent frequency lies in its ability to facilitate comparisons between datasets of varying sizes. By expressing the frequency of events as a percentage, we remove the influence of sample size, enabling us to identify meaningful differences or similarities between datasets. This is particularly useful when working with data collected from different populations, sources, or time periods.
In summary, percent frequency is an indispensable tool for data analysis and summarization, offering a standardized and informative way to understand data patterns. Its applications extend from descriptive statistics to inferential statistics and hypothesis testing, making it a versatile and powerful concept in the realm of data analysis.
Applications of Percent Frequency
Percent frequency is a powerful tool that finds applications in various fields, including statistics, research, data analysis, and beyond. By calculating the percentage of observations within a category, we gain valuable insights into the distribution and patterns within our data.
Descriptive Statistics
Percent frequency plays a crucial role in descriptive statistics, which aims to summarize and present data in a meaningful way. By calculating the percent frequency of different values or categories, we can gain quick insights into the central tendencies and variability within our data. For example, in a survey on consumer preferences, the percent frequency of different product ratings provides a quick overview of the most and least preferred products.
Inferential Statistics
Percent frequency also serves as a foundation for inferential statistics, which involves making inferences about a larger population based on a sample. By calculating the percent frequency of specific attributes in our sample, we can estimate the corresponding percentages in the population. This knowledge allows us to draw conclusions and make predictions about the broader population.
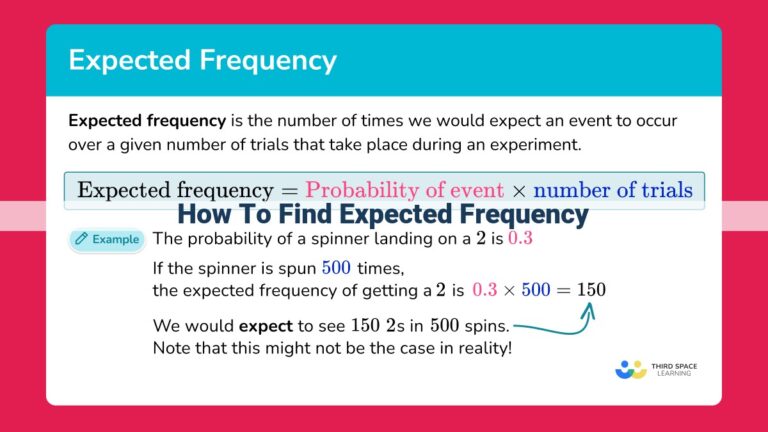
Hypothesis Testing
Percent frequency is integral to hypothesis testing, a fundamental aspect of statistical analysis. Hypothesis testing involves comparing observed data to expected values to determine whether a hypothesis is supported or rejected. By calculating the percent frequency of observations that support or contradict the hypothesis, we can evaluate its validity and make informed decisions about the likelihood of our assumptions.
In summary, percent frequency is a versatile tool that provides valuable insights into data distribution, trends, and patterns. Its applications extend to a wide range of disciplines, aiding in the effective analysis, interpretation, and inference of data.