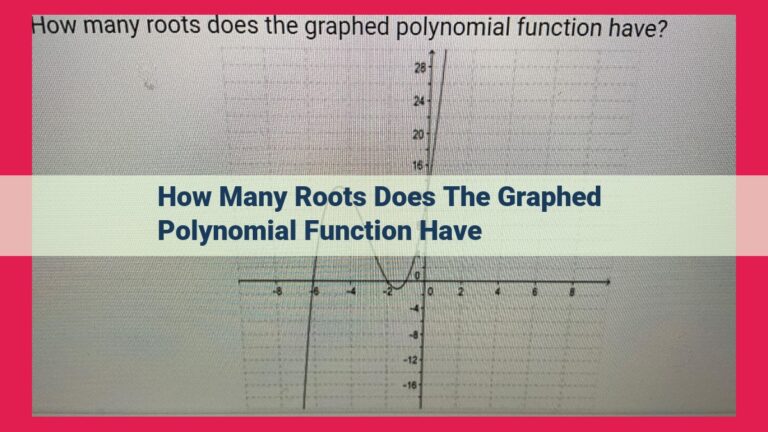
Understanding Polynomial End Behavior: A Guide To Graphing With Confidence
To determine the end behavior of a polynomial, analyze its degree and leading coefficient. For even degrees, the leading coefficient determines the parabola’s direction (upward or downward). For odd degrees, it dictates the graph’s behavior at infinity (upward or downward). The end behavior formula aids in calculations based on these factors. Understanding these principles empowers you to predict the shape and direction of polynomial graphs as x approaches positive or negative infinity.
Understanding End Behavior: A Key Tool for Graphing
- Definition and significance of end behavior in polynomial analysis.
Understanding End Behavior: A Key Tool for Graphing Polynomials
When it comes to graphing polynomials, end behavior plays a crucial role in painting a clear picture of a polynomial’s graph. End behavior refers to the behavior of a polynomial function as the input values approach positive or negative infinity. It provides valuable insights into the shape and direction of a polynomial graph.
The key to understanding end behavior lies in two influential factors: the leading coefficient and the degree of the polynomial. The leading coefficient, the coefficient of the highest degree term in a polynomial, determines the overall “slant” or steepness of the graph. A positive leading coefficient suggests an upward slant, while a negative coefficient indicates a downward slant.
The degree of a polynomial, on the other hand, classifies it as either even or odd. Even-degree polynomials exhibit a parabolic shape, meaning they resemble the shape of a parabola. The leading coefficient dictates the direction of the parabola, with a positive coefficient indicating an upward opening parabola and a negative coefficient indicating a downward opening parabola.
Odd-degree polynomials, in contrast, do not form parabolas. Instead, they exhibit a non-parabolic shape that is either increasing or decreasing as the input values approach infinity. Again, the leading coefficient plays a pivotal role in determining the direction of the graph, with a positive coefficient indicating an upward increasing trend and a negative coefficient indicating a downward decreasing trend.
To summarize, by studying the leading coefficient and degree of a polynomial, we can predict the end behavior of the polynomial function. A positive leading coefficient indicates an upward trend or an upward opening parabola, while a negative leading coefficient indicates a downward trend or a downward opening parabola. Even degrees result in parabolic shapes, while odd degrees result in non-parabolic shapes. By understanding these concepts, we gain a powerful tool for sketching polynomial graphs accurately and efficiently.
The Impact of Leading Coefficient: Shaping the Graph’s Slant
In the world of polynomial graphs, the leading coefficient is the unsung hero guiding the graph’s trajectory as it stretches to infinity. This pivotal coefficient holds the key to unlocking the secrets of a polynomial’s end behavior, revealing how it rises or falls as we venture far beyond the visible range.
Imagine a graph as a roller coaster, gracefully weaving through the ups and downs of the unknown. The leading coefficient is the invisible force that determines the overall slant of this roller coaster, dictating whether it ascends or descends as it approaches infinity.
For instance, consider the polynomial y = 2x^2 – 3x + 1. Its leading coefficient is a positive 2, indicating that the graph will rise as it goes to infinity. This is because the exponent of the leading term (x^2) is even, and any polynomial with an even leading term will curve upward towards infinity.
Conversely, if the leading coefficient were negative, such as in y = -x^3 + 2x^2 – 5, the graph would fall as it stretches beyond our reach. This time, the leading term (x^3) has an odd exponent, and any polynomial with an odd leading term will curve downward towards infinity.
Thus, the leading coefficient plays a crucial role in shaping the graph’s “slant”, providing a sneak peek into its ultimate behavior at the far ends of the number line.
Classifying Polynomials by Degree: Even vs. Odd
Polynomials, those enigmatic mathematical expressions, exhibit a captivating characteristic known as end behavior. Understanding end behavior is paramount for effective graphing, unraveling the secrets of how polynomials behave at the distant ends of their domain. One crucial aspect that influences end behavior is the degree of the polynomial.
Even Degrees
When a polynomial’s degree is even, its graph takes on a parabolic shape. Think of a graceful arc, curving gently towards the sky or dipping down like a valley. The leading coefficient, the coefficient of the term with the highest degree, dictates the slant of this parabola. A positive leading coefficient sends the parabola soaring upward, while a negative leading coefficient brings it swooping down.
Odd Degrees
Polynomials with odd degrees behave differently. Their graphs lack the graceful curves of their even-degree counterparts, instead resembling jagged or angled shapes. The leading coefficient still plays a crucial role, determining the direction of the graph as it approaches infinity. A positive leading coefficient sends the graph rising endlessly, while a negative leading coefficient sends it plummeting.
The Intuition Behind the Patterns
The distinct end behavior patterns of even and odd degree polynomials stem from their underlying algebraic structures. Even degree polynomials possess a symmetry around their maximum or minimum point, making their graphs mirror images of each other. Odd degree polynomials, on the other hand, lack this symmetry, resulting in their jagged or angled shapes.
Classifying polynomials by their degree, even or odd, provides a valuable insight into their end behavior. Understanding these patterns equips us with a powerful tool for graphing polynomials, enabling us to predict their behavior at the distant ends of their domain and gain a deeper comprehension of their mathematical beauty.
End Behavior Patterns for Even Degrees
In the realm of polynomial analysis, the concept of end behavior empowers us to unravel the secrets of a graph’s curvature as it stretches towards infinity. For polynomials with even degrees, a captivating parabolic dance unfolds before our very eyes.
The leading coefficient, the orchestrator of a polynomial’s character, determines the direction of this parabolic journey. If this coefficient is positive, like a maestro guiding an orchestra, it ushers the parabola upwards, inviting it to soar towards the sky as it approaches infinity.
On the other hand, when the leading coefficient wears a negative veil, it conjures a graceful downward glide, compelling the parabola to dip below the horizon, its embrace inviting the depths as it vanishes into infinity.
Imagine the parabola as a mischievous child, its mood dictated by the whims of the leading coefficient. When this coefficient exudes positivity, the child skips and leaps with an upward trajectory, each step carrying it higher towards the heavens. But when the coefficient dons a negative cloak, the child transforms into a graceful swan, gliding effortlessly downwards, its wings tracing an elegant arc that curves below the horizon.
Unveiling the Patterns of End Behavior in Odd Degree Polynomials
Polynomials are mathematical expressions composed of variables raised to non-negative integer powers and multiplied by coefficients. Understanding the end behavior of polynomials – how they behave as their inputs approach infinity or negative infinity – is crucial for analyzing their graphs.
Odd degree polynomials are those with exponents of odd degree. Unlike even degree polynomials, which exhibit parabolic shapes, odd degree polynomials possess non-parabolic shapes. The leading coefficient, the coefficient of the highest degree term, plays a pivotal role in determining the graph’s direction at infinity.
Leading Coefficient and End Behavior
-
For odd degree polynomials with a positive leading coefficient, the graph will rise indefinitely as the input approaches positive infinity and fall indefinitely as the input approaches negative infinity.
-
Conversely, if the odd degree polynomial has a negative leading coefficient, the graph will fall indefinitely as the input approaches positive infinity and rise indefinitely as the input approaches negative infinity.
Graphical Representation
Imagine a polynomial function, f(x) = x³ - 2x + 5. The odd degree (3) and positive leading coefficient (1) imply that the graph will rise without bound as x approaches infinity and fall without bound as x approaches negative infinity.
In contrast, the function g(x) = -x³ + 4x - 1 has an odd degree (3) but a negative leading coefficient (-1). As x approaches infinity, the graph will fall indefinitely, and as x approaches negative infinity, the graph will rise indefinitely.
Significance
Understanding the end behavior of odd degree polynomials is essential for sketching their graphs. It provides a framework for predicting the trend of the graph as the input values become very large or very small. This knowledge is invaluable in various applications, such as analyzing limits, determining concavity, and finding asymptotic behavior.
The End Behavior Formula: A Key to Unlocking Polynomial Graphs
In the realm of polynomials, understanding end behavior is crucial for unraveling the secrets of their enigmatic graphs. Armed with the End Behavior Formula, you can effortlessly predict the direction in which a polynomial soars or plummets as it ventures towards infinity.
The formula, a deceptively simple yet profoundly powerful tool, is crafted from two key elements: the leading coefficient and the degree of the polynomial. The leading coefficient, like a mischievous conductor, orchestrates the slope of the graph’s journey, while the degree, a faithful companion, determines its shape.
To harness the power of the formula, embark on the following steps:
Step 1: Locate the Leading Coefficient
Identify the coefficient of the term with the highest exponent, which represents the polynomial’s leading coefficient. This coefficient holds the key to the graph’s slant.
Step 2: Ascertain the Degree
Determine the highest exponent in the polynomial. This number reveals the degree, which profoundly influences the graph’s overall shape.
Step 3: Apply the Formula
With the leading coefficient and degree in hand, you can now apply the formula:
- If the degree is even, the graph will:
- Rise if the leading coefficient is positive
- Fall if the leading coefficient is negative
- If the degree is odd, the graph will:
- Rise at the right end and fall at the left end if the leading coefficient is positive
- Fall at the right end and rise at the left end if the leading coefficient is negative
Example:
Consider the polynomial: f(x) = 2x^4 + 3x^2 - 5
- Leading coefficient: 2 (positive)
- Degree: 4 (even)
Applying the formula, we can conclude that the graph of f(x) will rise as x approaches infinity.
Unveiling End Behavior: The Key to Polynomial Graphing
In the fascinating world of mathematics, understanding the end behavior of polynomials is a crucial skill that empowers us to accurately graph these functions. End behavior refers to the direction in which a polynomial approaches infinity on the coordinate plane. By examining the leading coefficient and degree of a polynomial, we can unlock the secrets of its end behavior.
The Impact of the Leading Coefficient
The leading coefficient, the coefficient of the term with the highest exponent, plays a pivotal role in determining the steepness and “slant” of a polynomial graph. If the leading coefficient is positive, the graph will rise steeply as x approaches infinity. Conversely, if it’s negative, the graph will descend sharply towards negative infinity. The magnitude of the leading coefficient dictates the extent of this rise or fall.
Classifying Polynomials by Degree
Polynomials also exhibit distinct end behaviors based on their degree, which is the highest exponent present. Even degree polynomials produce graphs that are parabolic in shape, resembling an upside-down or right-side-up parabola. The direction of this parabola is influenced by the leading coefficient, as mentioned earlier.
Odd degree polynomials, on the other hand, create non-parabolic graphs. They exhibit a more linear behavior, approaching infinity in a specific direction based on the leading coefficient.
The End Behavior Formula: A Simple Tool
To simplify the analysis of end behavior, mathematicians have devised a formula:
End Behavior = ((-1)^(degree)) * (leading coefficient)
This formula helps determine the direction of the graph at infinity based on the degree and leading coefficient.
Applying End Behavior Concepts in Practice
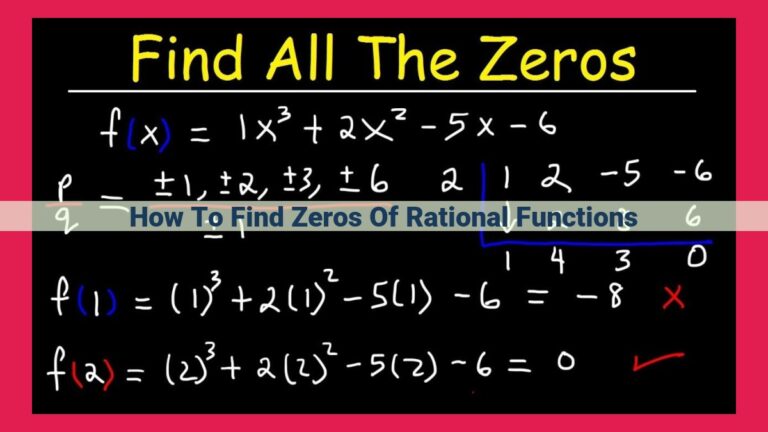
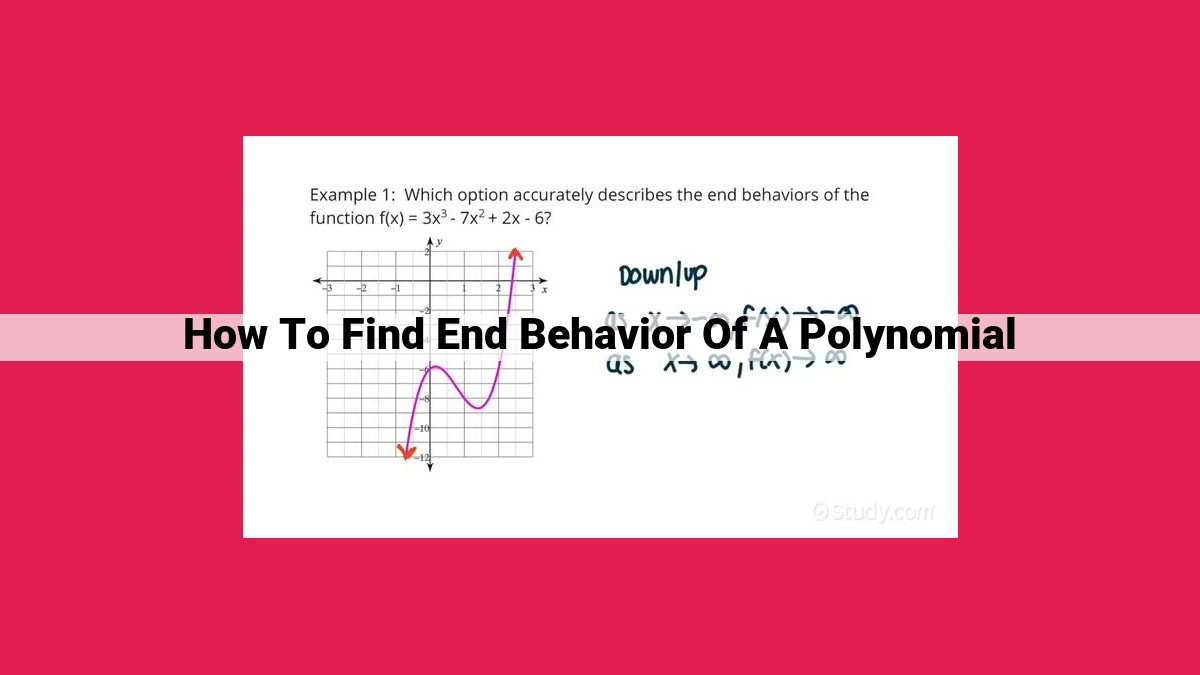
Let’s consider an example: the polynomial f(x) = x^3 + 2x^2 – 5x – 6. The leading coefficient is positive (1), and the degree is odd (3). According to our formula, the end behavior is:
End Behavior = (-1)^(3) * 1 = -1
This indicates that the graph of f(x) will descend towards negative infinity as x approaches both positive and negative infinity. Armed with this knowledge, we can confidently sketch the graph of f(x) without the need for extensive point plotting.