Percentage Frequency: A Comprehensive Guide For Analyzing Data Patterns
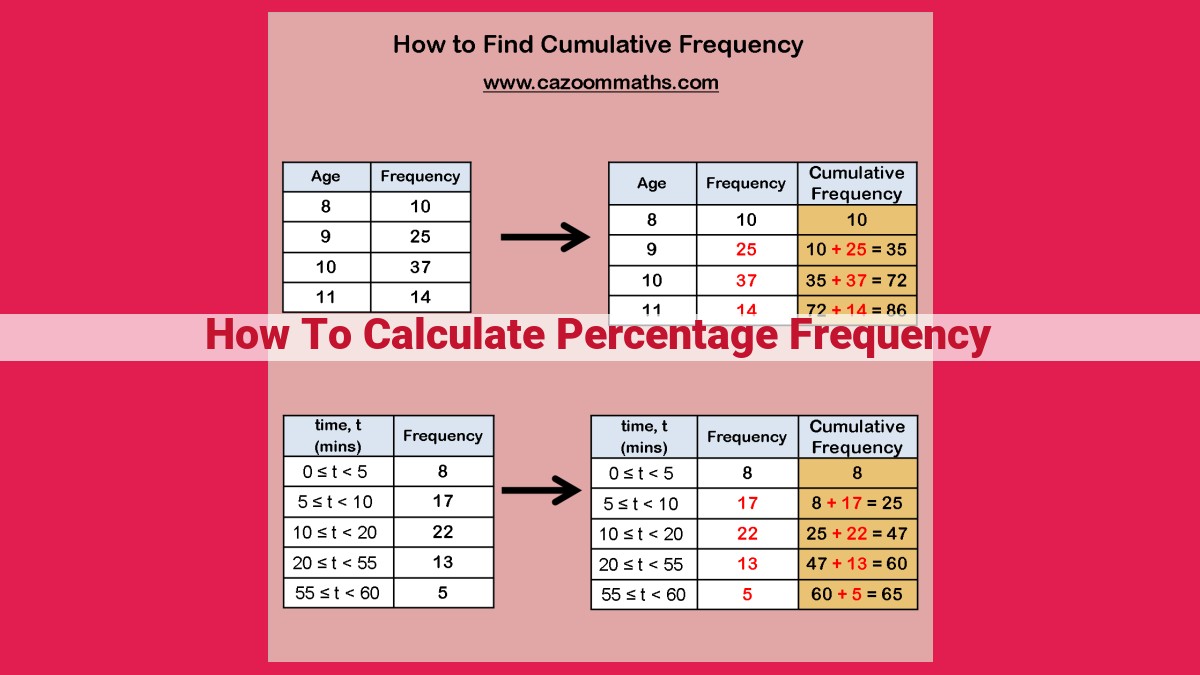
Percentage frequency quantifies the proportion of observations within a category, expressed as a percentage. To calculate, divide the absolute frequency (count of observations in a category) by the total frequency (count of all observations) and multiply by 100. Percentage frequency provides a normalized measure, making comparisons between categories with different sample sizes easier. It is used in various fields, including research, healthcare, and marketing, to analyze data patterns, make informed decisions, and draw meaningful conclusions.
Percentage Frequency: A Vital Tool for Data Analysis
In the realm of statistical analysis, percentage frequency emerges as a crucial concept for understanding the distribution and patterns within data. It provides a clear depiction of how often a specific occurrence or value appears within a dataset, enabling researchers, analysts, and decision-makers to draw meaningful insights. Percentage frequency serves as a powerful tool for uncovering trends, making comparisons, and informing informed conclusions.
Types of Frequency
The broader concept of frequency encompasses two key types:
- Absolute frequency: The raw count of occurrences for a particular value or category within a dataset.
- Total frequency: The sum of all absolute frequencies across all values or categories.
Comprehension of these frequency types is essential for understanding the basis of percentage frequency calculations.
Calculating Percentage Frequency
Percentage frequency is calculated using the following formula:
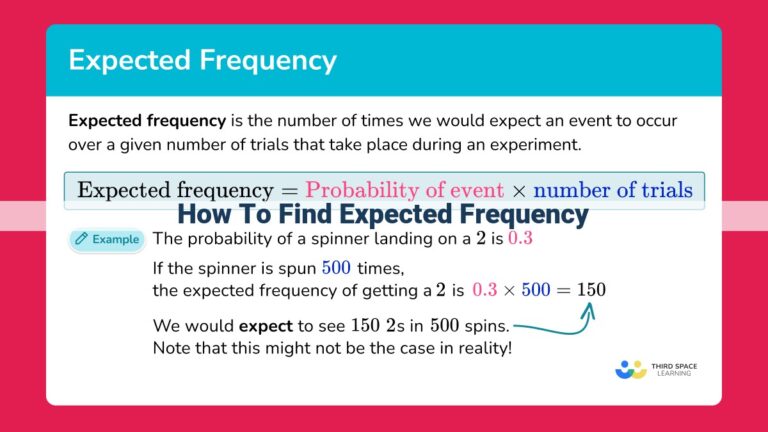
Percentage Frequency = (Absolute Frequency / Total Frequency) x 100
The resulting value represents the proportion of the total dataset that corresponds to a specific value or category. By expressing frequency as a percentage, we gain a standardized measure that facilitates comparisons and allows for the identification of patterns and trends within data.
Applications of Percentage Frequency
Percentage frequency finds widespread use in various fields, including:
- Market research: Determining the distribution of consumer preferences, brand awareness, and product usage.
- Healthcare: Analyzing the prevalence of diseases, evaluating treatment outcomes, and monitoring patient demographics.
- Education: Assessing student performance, measuring the effectiveness of teaching methods, and tracking attendance rates.
Advantages and Limitations
Like any statistical measure, percentage frequency possesses both strengths and limitations:
Advantages:
* Standardized metric allowing for easy comparisons.
* Provides a clear understanding of data distribution.
* Simplifies the identification of trends and patterns.
Limitations:
* Can be misleading if the total frequency is low.
* May not capture all relevant information, particularly in complex datasets.
Percentage frequency is a valuable tool for researchers, analysts, and decision-makers seeking to gain insights from data. By understanding the concepts of frequency, the formula for calculating percentage frequency, and its diverse applications, we can harness its power to uncover patterns, make informed decisions, and enhance our understanding of the world around us.
Types of Frequency
When it comes to analyzing data, understanding the different types of frequency is crucial. Frequency refers to the number of times a particular value or event occurs in a dataset. Two primary types of frequency are absolute frequency and total frequency.
Absolute frequency represents the exact number of times a particular value appears in a dataset. For example, if you’re analyzing a dataset of customer ages and find that the value “25” appears 12 times, the absolute frequency of “25” would be 12.
Total frequency is the sum of the absolute frequencies of all values in a dataset. In our customer age example, if the dataset contains 100 customers, the total frequency would be 100.
Understanding these two types of frequency is essential for accurately analyzing and interpreting data. By grasping the concept of absolute and total frequency, you can gain valuable insights into the distribution and patterns within your dataset.
Calculating Percentage Frequency: A Guide to Understanding Data Distribution
Percentage frequency is an essential statistical measure that helps us understand how data is distributed within a given dataset. It expresses the proportion of observations that fall within a specific category or range.
To calculate percentage frequency, we use the following formula:
Percentage Frequency = (Absolute Frequency / Total Frequency) x 100
Here’s what each component of the formula means:
- Absolute Frequency: The number of observations that belong to a particular category or range.
- Total Frequency: The total number of observations in the dataset.
Interpreting the Resulting Value
The resulting value of the percentage frequency is expressed as a percentage. It indicates the proportion of observations that fall within the specific category or range relative to the entire dataset. For example, if the percentage frequency is 25%, it means that 25% of the observations in the dataset belong to that particular category or range.
Example Calculation
Let’s say we have a dataset of 100 survey responses. Of these responses, 20 people indicated that they prefer chocolate ice cream. To calculate the percentage frequency of chocolate ice cream preferences, we use the formula:
Percentage Frequency = (20 / 100) x 100
= 20%
This result indicates that 20% of the respondents prefer chocolate ice cream.
Unveiling the Significance of Percentage Frequency: A Comprehensive Guide
Percentage frequency, a crucial concept in statistical analysis, reveals how often an element occurs within a dataset. It’s the indispensable tool for understanding data distribution and making informed decisions.
Types of Frequency:
Frequency can be categorized into absolute and total. Absolute frequency tallies the number of times an element appears, while total frequency represents the entire dataset’s count.
Calculating Percentage Frequency:
To calculate percentage frequency, employ this formula:
Percentage Frequency = (Absolute Frequency / Total Frequency) * 100
This value signifies the proportion of the element within the dataset. For instance, a percentage frequency of 20% indicates that the element occurs in 20 out of 100 observations.
Example Calculation:
Let’s calculate the percentage frequency of the letter “A” in the word “BANANA”.
- Absolute frequency: 3 (A appears 3 times)
- Total frequency: 6 (Total number of letters)
Using the formula:
Percentage Frequency = (3 / 6) * 100 = 50%
Therefore, the letter “A” appears in 50% of the word “BANANA”.
Applications of Percentage Frequency:
Percentage frequency finds widespread application in various fields:
- Market research: Understanding consumer preferences and trends
- Healthcare: Analyzing disease prevalence and treatment outcomes
- Education: Assessing student performance and identifying learning gaps
Advantages and Limitations of Percentage Frequency:
Percentage frequency offers several advantages:
- Easy to understand and interpret
- Provides a quick snapshot of data distribution
However, limitations arise when dealing with:
- Small datasets: May not be reliable due to limited observations
- Multiple categories: Can become difficult to compare frequencies across many categories
Percentage frequency stands as a foundational concept in statistical analysis, empowering us to comprehend data patterns and make well-informed decisions. By understanding its calculation and interpretation, we can harness its potential to unravel hidden insights from our data.
Applications of Percentage Frequency
Understanding Consumer Behavior
- Retailers use percentage frequency to analyze customer purchases, identifying frequently bought items and cross-selling opportunities.
- Businesses calculate the frequency of specific products or services purchased by loyal customers to target personalized promotions.
Medical Research
- Epidemiologists study the frequency of diseases in different populations to understand their prevalence and risk factors.
- Clinical trials use percentage frequency to assess the effectiveness of new treatments by comparing the frequency of positive outcomes in experimental and control groups.
Education
- Educators analyze student test scores using percentage frequency to identify areas where students struggle and tailor instruction accordingly.
- They also calculate the frequency of students passing or failing to evaluate teaching effectiveness and curriculum design.
Market Research
- Marketers determine the frequency with which consumers engage with their products or services (e.g., website visits, social media interactions) to gauge brand awareness and customer engagement.
- Advertisers use frequency tables to track the number of times an advertisement is seen by a specific audience, helping them optimize advertising campaigns.
Decision-Making
- Policymakers calculate the percentage frequency of various crimes to prioritize law enforcement efforts.
- Engineers assess the frequency of component failures to improve product reliability.
- Investors analyze the historical frequency of stock market performance to make informed investment decisions.
By understanding the frequency of events, organizations can make data-driven decisions, allocate resources efficiently, and gain valuable insights into their operations and customers.
Advantages and Limitations of Percentage Frequency
Understanding the Advantages:
Percentage frequency offers several advantages in statistical analysis. It simplifies understanding by expressing the occurrence of events as a fraction of the total, making it easy to compare different groups or categories. This ease of interpretation is particularly valuable for non-statisticians and audiences who may not be familiar with more complex measures. Additionally, percentage frequency allows for cross-study comparison despite differences in sample sizes, as it presents data in a standardized format.
Recognizing the Limitations:
Despite its advantages, percentage frequency also has certain limitations. It can be misleading when applied to small samples, as even minor variations in counts can lead to substantial changes in percentages. Moreover, percentage frequency does not consider the total number of observations, so it may not accurately represent the true prevalence of events when sample sizes differ significantly. It can also be sensitive to outliers, as extreme values can disproportionately affect the percentage outcome.
Appropriate Usage:
Percentage frequency is best suited for analyzing categorical data where events are clearly defined and mutually exclusive. It is particularly useful when comparing proportions across different groups or categories, especially when sample sizes are sufficiently large. However, when dealing with numerical data or small samples, alternative measures such as mean, median, or mode may be more appropriate.
Percentage frequency is a valuable tool for presenting and comparing categorical data, offering simplicity and ease of interpretation. However, it is essential to recognize its limitations and use it judiciously, considering sample size and the type of data being analyzed. By understanding the strengths and weaknesses of percentage frequency, researchers can make informed decisions about its appropriate application in statistical analysis.
