Mastering Linear Equations: A Comprehensive Guide To Finding Solution Sets
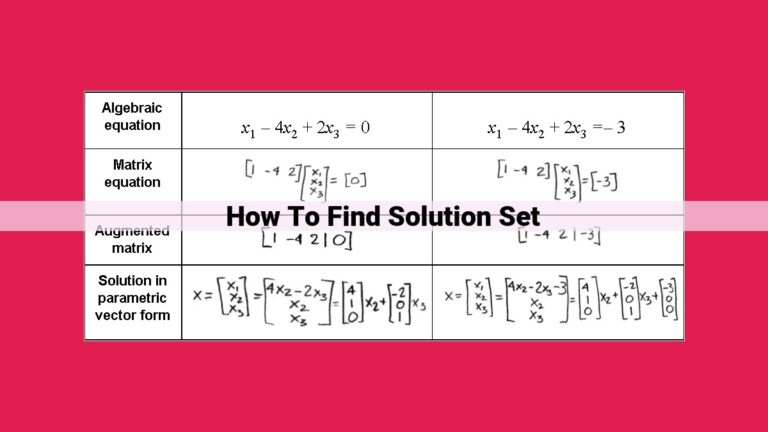
To find the solution set of a linear equation in two variables, start by graphing the equation. The solution set is the set of all points that lie on the graph. To find these points, you can use intercepts (x-intercepts and y-intercepts), which are the points where the graph crosses the x-axis and y-axis, respectively. Additionally, you can use the slopes of parallel and perpendicular lines to determine if lines are related and to solve equations. By understanding these concepts, you can effectively find the solution sets of linear equations, which have practical applications in various fields.
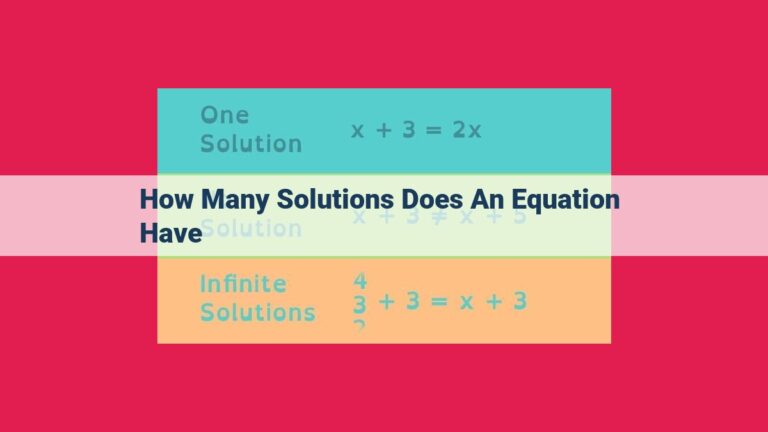
Understanding the Concept of Solution Sets
In the realm of mathematics, solution sets play a pivotal role in unlocking the mysteries of mathematical problems. They’re like the keys that open the doors to unknown quantities, revealing the secrets hidden within equations.
Solution sets represent all the possible values that satisfy a given equation or inequality. Think of them as a collection of numbers that, when plugged into the equation, make the equation true. They provide a roadmap for solving complex mathematical puzzles, revealing the solutions that lie at the end of the path.
The relationship between solution sets and relations is intertwined. A relation is a set of ordered pairs, and solution sets are formed when the domain and range of a relation intersect. It’s like a puzzle where the pieces fit together perfectly, forming a complete picture.
Linear Equations in Two Variables: Unraveling the Mystery of Solution Sets
In the realm of mathematics, we often encounter equations that involve two variables, such as x and y. These equations, known as linear equations in two variables, are fundamental tools for solving a wide range of problems.
Unveiling the Essentials
Every linear equation in two variables can be expressed in standard forms, the most common being the slope-intercept form:
y = mx + b
where:
- m is the slope, which tells us how steeply the line rises or falls.
- b is the y-intercept, which indicates where the line crosses the y-axis.
Another useful form is the point-slope form:
y - y1 = m(x - x1)
where (x1, y1) is a known point on the line.
Visualizing Solutions: Graphing Linear Equations
To fully understand linear equations, it’s crucial to visualize their graphs. We can graph lines by:
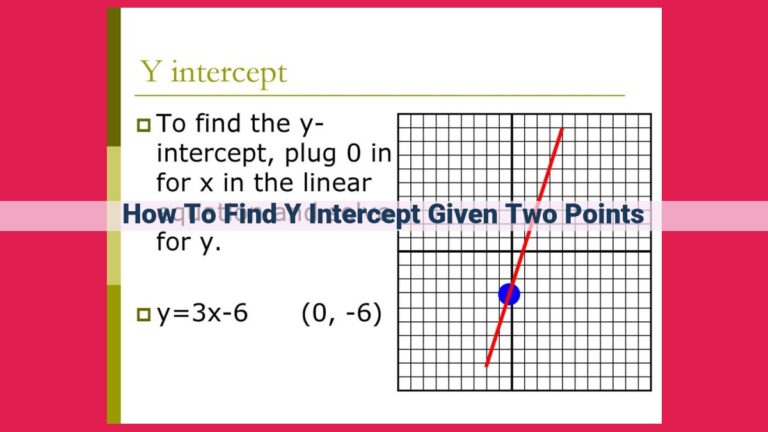
- Plotting the intercepts: The y-intercept is the point where the line crosses the y-axis (0, b), while the x-intercept is the point where it crosses the x-axis (x = -b/m).
- Using the slope and intercept: Start from the y-intercept (0, b), then move m units up or down and 1 unit to the right to find another point on the line.
- Performing transformations: Translate (move) the line horizontally or vertically to graph variations of the same equation.
By analyzing the graph, we can quickly determine the solution set of the equation. The solution set is the set of all points that satisfy the equation, represented by ordered pairs (x, y).
A Deeper Dive into Solution Sets
Understanding solution sets is vital in solving real-world problems. For instance, in economics, a linear equation can model the relationship between the quantity of a product supplied and its price. By finding the solution set of the equation, we can determine the price at which the supply and demand are balanced.
In conclusion, linear equations in two variables are powerful tools for solving problems. By mastering the concept of _solution sets_, graphing techniques, and standard forms, we can unlock the mysteries of these equations and apply them to various fields to solve complex real-world scenarios.
Intercepts: Unveiling the Secrets of Linear Equations
In the realm of linear equations, intercepts play a crucial role in deciphering their graphical behavior and solving them effectively. Let’s delve into the fascinating world of x-intercepts and y-intercepts!
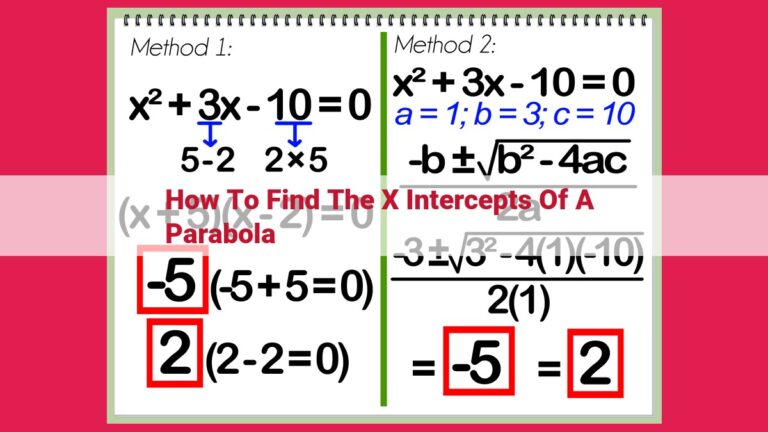
X-Intercepts: The Roots of the Matter
X-intercepts are points on the graph where the line intersects the x-axis. They represent the values of x when y is zero. Geometrically, x-intercepts show the points where the line crosses the vertical axis.
Y-Intercepts: Unveiling the Vertical Shift
Y-intercepts are points on the graph where the line intersects the y-axis. They represent the values of y when x is zero. In simpler terms, y-intercepts indicate the vertical shift of the line from the origin.
The Interpretive Power of Intercepts
Intercepts are more than mere points on a graph; they hold immense power in solving linear equations:
- Solving Equations: Intercepts provide a simple and effective way to solve equations. Setting y to zero gives the equation for the x-intercept, while setting x to zero gives the equation for the y-intercept.
- Key Points on the Graph: Intercepts mark important points on the graph that help sketch its shape and identify its key features.
Practical Applications of Intercepts
The concept of intercepts extends beyond the confines of mathematics classrooms. They find practical applications in various fields:
- Physics: X-intercepts represent the time when an object reaches a specific position in motion.
- Chemistry: Y-intercepts indicate the initial concentration of a reactant in a chemical reaction.
- Economics: Intercepts determine the fixed costs or profits in a business model.
Intercepts are essential for comprehending the graphical behavior and solving linear equations. They provide a valuable tool for analyzing and interpreting these equations in real-world scenarios. By mastering the concept of intercepts, you’ll unlock a deeper understanding of linear algebra and its wide-ranging applications.
Parallel and Perpendicular Lines: The Dance of Slopes
In the world of linear equations, lines play a starring role. And when two lines cross paths, their slopes take the stage to determine their destiny: parallelism or perpendicularity.
Parallel Lines: The Slope Siblinghood
Imagine two lines, sisters in the realm of geometry, running side by side with unwavering parallelism. Their slopes are like identical twins, sharing the same numerical value. This siblinghood ensures that the lines never meet, maintaining their equidistance as they stretch into infinity.
Perpendicular Lines: The Slope Flip-Flop
Now, let’s introduce two lines that take a different approach. They’re like sworn enemies, perpendicular to each other. Their slopes, like sworn opposites, take on opposite signs. When one line slants up, the other slants down, forming a perfect 90-degree angle at their intersection.
Determining Line Relationships:
So, how do we know if lines are parallel or perpendicular? It’s all in the slope equation!
- Parallel Lines: Slopes are equal.
- Perpendicular Lines: Slopes are negative reciprocals of each other.
Example Time:
Let’s say we have two lines: L1 with slope 2 and L2 with slope -1/2.
- Parallel Lines? No, because their slopes are not equal.
- Perpendicular Lines? Yes, because their slopes are negative reciprocals of each other (-2 and 1/2).
Real-World Impact:
Understanding parallel and perpendicular lines is not just a geometric curiosity. It has practical applications in various fields:
- Architecture: Designing buildings that stand tall and stable.
- Engineering: Creating bridges that span rivers and gaps.
- Physics: Describing the motion of objects under gravity.
Parallel and perpendicular lines, intertwined by their slopes, play a crucial role in solving equations and understanding the world around us. By grasping their dance, we unlock the power to unravel complex problems and create elegant solutions.