How To Calculate The Median From A Frequency Table: A Comprehensive Guide
To find the median from a frequency table, first understand it as the middle value of a dataset. From the table, create a cumulative frequency column and find the value at N/2 (half of the total frequency). If the value is in a class interval, find the median using interpolation. The median divides the data into two equal halves, making it a significant measure of central tendency.
Understanding the Concept of Median
- Explain the definition of median and its significance in data analysis.
Understanding the Concept of Median
Do you find yourself overwhelmed by the barrage of numerical data that surrounds us? Fear not, dear reader, for the median, a statistical gem, can illuminate the path to data comprehension. The median is a beacon of clarity, standing as the middle value when a set of numbers is arranged in ascending order. It acts as a robust measure of central tendency, unraveling the meaning hidden within the data.
In the realm of data analysis, the median holds a special place. It remains unperturbed by extreme values, unlike the mean, its more volatile cousin. This resilience makes it an invaluable tool for understanding skewed distributions, where a few outliers can distort the perception of the data’s central tendency. By providing a stable reference point, the median empowers us to make informed decisions and draw meaningful conclusions from our datasets.
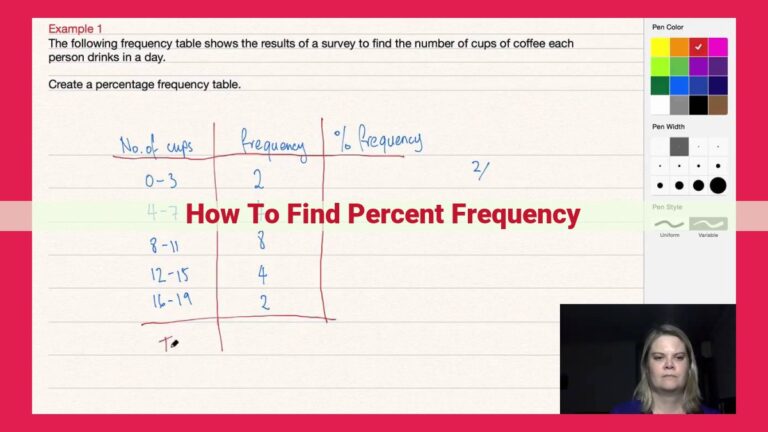
Frequency Table: A Gateway to Unveiling Data Patterns
In the realm of data analysis, frequency tables emerge as powerful tools, painting a vivid picture of data distribution. These tables provide a structured representation of data, neatly organizing it into discrete classes and corresponding frequencies. Each class represents a range of values, while the frequency indicates the number of data points that fall within that range. This structured arrangement empowers analysts to gain insights into central tendencies and data variability.
Building a frequency table is a straightforward process. Begin by defining clear class intervals, ensuring they are mutually exclusive and collectively exhaustive, meaning there are no overlaps or gaps in the data representation. Assign each data point to its corresponding class, meticulously tallying the frequencies. The resulting frequency table offers a clear visual representation of how often values occur within different ranges, providing a solid foundation for further data exploration.
Additionally, frequency tables share a close relationship with two other graphical representations of data: histograms and bar charts. Histograms depict data distribution using a series of adjacent rectangles, where the height of each rectangle represents the frequency within the corresponding class interval. Bar charts, on the other hand, use vertical bars to represent frequencies, with each bar representing a specific class. Both histograms and bar charts offer visual aids to enhance the interpretation of frequency tables, allowing analysts to quickly grasp data patterns and trends.
Cumulative Frequency: Your Secret Weapon for Finding Median
When embarking on the data analysis journey, there are indispensable tools that can guide you towards meaningful insights. Among them, the median stands out as a crucial statistic, and it’s where cumulative frequency comes into play.
What is Cumulative Frequency?
Cumulative frequency simply adds up the frequencies of all values below a certain value in a dataset. It is a running total that allows us to trace the distribution of data. By visualizing the cumulative frequency in a table, we can see how many data points fall below each value.
Cumulative Frequency and the Median
The median is the middle value in a dataset, and finding it from a cumulative frequency table is a breeze. The median corresponds to the value where the cumulative frequency reaches 50% or half of the total data points.
Percentiles: Unlocking the Power of Data Division
Percentiles are closely related to cumulative frequency. They divide data into equal parts, each representing a percentage of the total. The median is a special type of percentile, specifically the 50th percentile. Other common percentiles include the 25th (Q1) and 75th (Q3) percentiles, which divide the data into quarters.
Cumulative frequency and percentiles are invaluable tools for understanding data distribution and finding the median. By leveraging these concepts, we can unlock powerful insights and make informed decisions based on data. Remember, the median provides a robust measure of the central tendency of a dataset, making it an essential statistic in your data analysis toolkit.
Finding the Median Using N/2: A Simple Guide
In data analysis, finding the median is a crucial step to summarize and understand the central tendency of a dataset. Among the various methods to calculate the median, using the formula N/2 offers a straightforward approach when working with a frequency table.
Understanding the Formula
The formula N/2 represents the position of the median in a dataset when arranged in ascending order. N denotes the total number of observations in the frequency table. The median is the middle value that divides the dataset into two equal halves, with half of the values falling below it and the other half above it.
Applying N/2 to Frequency Tables
To find the median using N/2, follow these steps:
- Calculate the cumulative frequency by adding the frequencies of each class interval starting from the lowest class.
- Determine the position of N/2 in the cumulative frequency column.
- Identify the corresponding class interval that contains the N/2 position.
- If N/2 falls exactly on a class interval boundary, the median is the lower boundary of that class.
- If N/2 falls within a class interval, interpolate the median using the formula:
Median = Lower boundary of the class interval + (N/2 - Cumulative frequency of the previous class) * (Class interval width) / (Frequency of the class interval)
Example
Consider a frequency table with the following class intervals:
| Class Interval | Frequency | Cumulative Frequency |
|---|---|---|
| 10-19 | 5 | 5 |
| 20-29 | 7 | 12 |
| 30-39 | 9 | 21 |
| 40-49 | 4 | 25 |
To find the median using N/2:
- N = 25 (total number of observations)
- N/2 = 12.5
- The 12.5 position falls within the 20-29 class interval.
- Using the interpolation formula:
Median = 20 + (12.5 - 12) * (10) / (7) = 22.85
Therefore, the median of the dataset is 22.85.
Using the N/2 formula to find the median from a frequency table is a convenient and accurate method. It allows researchers and analysts to quickly identify the central value of a dataset, providing valuable insights into its distribution and characteristics.
Class Interval: Decoding the Median’s Significance
In the realm of finding the median, class interval plays a pivotal role. It divides the data into manageable chunks, making it easier to determine the median value. The range of the data, which is the difference between the highest and lowest values, is divided into equal intervals. Each interval is then represented as a class.
Class interval width refers to the size of each class. It’s calculated by dividing the range by the number of desired intervals. For instance, if the range is 100 and you want 10 intervals, each interval would have a width of 10.
Understanding class intervals is crucial in finding the median because they allow us to estimate where the median value lies within a particular interval. This helps us narrow down our search and find the median more efficiently.
Step-by-Step Guide to Finding the Median
Finding the median of a data set is a crucial step in data analysis. It provides a clear representation of the data’s central tendency. In this guide, we will delve into a detailed, step-by-step approach to finding the median from a frequency table.
Step 1: Calculate the Cumulative Frequency
To find the median, we begin by calculating the cumulative frequency for each class interval. This involves adding the frequency of each interval to the cumulative frequency of the previous interval. The result is a running total that represents the number of data points below the upper limit of each interval.
Step 2: Identify the Median Class
The median is the middle value of a data set. To identify the median class, we divide the total number of data points (N) by 2. The resulting value, N/2, indicates the position of the median in the cumulative frequency.
Step 3: Interpolate the Median Value
Once we have identified the median class, we need to interpolate the median value. This is done by using the formula:
Median = Lower Class Limit of Median Class + [(Cumulative Frequency - N/2) / Frequency of Median Class] * Class Interval
Example:
Let’s say we have the following frequency table:
| Class Interval | Frequency | Cumulative Frequency |
|---|---|---|
| 0-10 | 5 | 5 |
| 10-20 | 10 | 15 |
| 20-30 | 15 | 30 |
To find the median:
-
Calculate the cumulative frequency for each class interval:
-
Identify the median class: N/2 = 30/2 = 15. The median is in the 20-30 class interval.
-
Interpolate the median value:
Median = 20 + [(30 - 15) / 15] * 10
Median = 20 + 1 * 10 = 30
Therefore, the median of the given frequency table is 30.