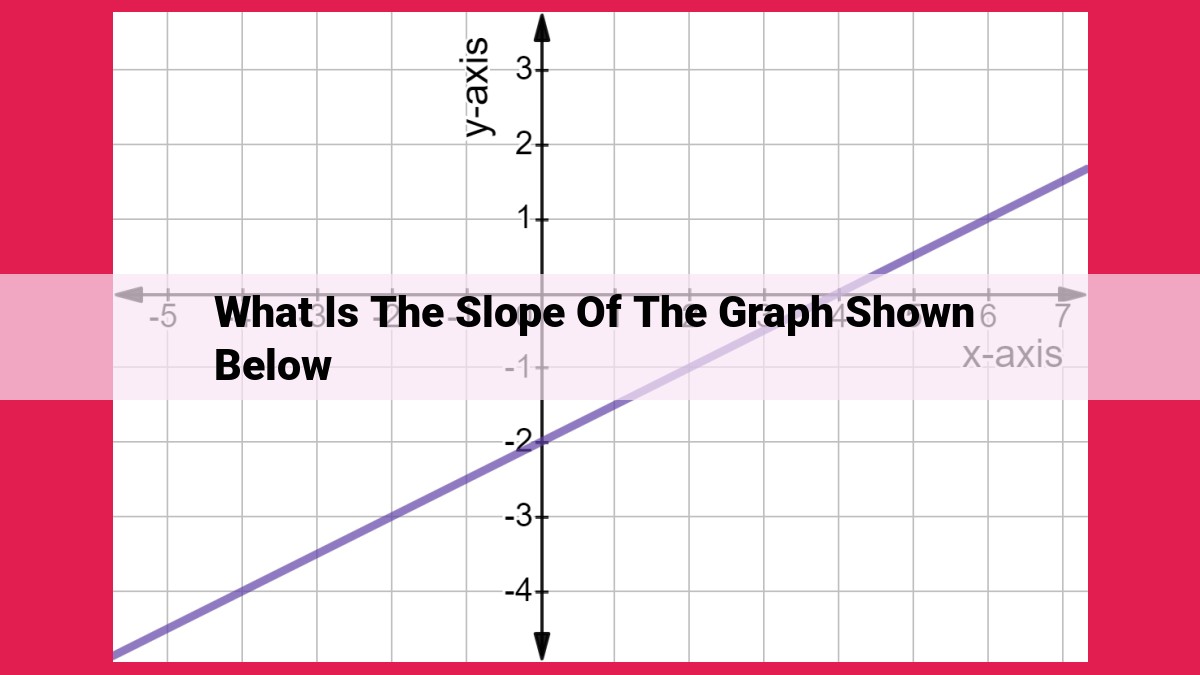
Understanding Graph Slope: Measuring Inclination And Its Significance

The slope of a graph measures the steepness or inclination of a line, indicating its rise over run. It is calculated as the ratio of the change in the y-axis (rise) to the corresponding change in the x-axis (run). Understanding slope helps determine the direction and steepness of a line, which is essential in various fields such as economics, physics, and engineering for analyzing growth rates, velocity, and gradients.
What is the Slope of a Graph?
Grasping the concept of slope is fundamental to understanding the behavior of graphs. It’s a measure of a line’s inclination or steepness, providing insights into the relationship between two variables.
Understanding slope is crucial in various fields, including math, physics, and economics. It allows us to make predictions, analyze trends, and draw conclusions based on the movement and direction of lines on a graph.
In simpler terms, slope tells us how much a line rises or falls as we move from one point to another. A steeper line indicates a greater change in the value of the dependent variable (y-axis) compared to the independent variable (x-axis). Conversely, a flatter line represents a smaller change or no change at all.
Concepts Involved in Slope
Before diving into the mathematical formula for calculating slope, let’s establish a solid understanding of the key terms involved: slope, rise, and run. These concepts will serve as the foundation for grasping the significance of slope and its applications.
Slope is a measure of the incline or steepness of a line. It describes how quickly the line rises or falls as you move along its path. Slope is often expressed as a ratio, comparing the rise to the run of a line.
Rise refers to the vertical change between two points on a line. It measures the distance the line moves in the up or down direction.
Run represents the horizontal change between the same two points. It captures how far the line moves to the right or left.
Relationship between Rise and Run:
The relationship between rise and run is crucial in determining the slope of a line. Slope can be calculated by dividing the rise (vertical change) by the run (horizontal change). This mathematical operation gives us a value that represents the inclination of the line.
Slope and Its Related Concepts
Comprehending the concept of slope is paramount in the realm of graphs. Slope serves as a quantifiable measure of a line’s steepness or inclination, providing valuable insights into its behavior and characteristics.
The Significance of Rise and Run
At the heart of slope determination lies the understanding of rise and run. Rise indicates the vertical change between two points on a line, while run measures the horizontal change. Understanding the interplay between rise and run forms the foundation for calculating slope.
Let’s consider an example. If a line rises 3 units vertically and runs 4 units horizontally, the rise is +3 and the run is +4. This information is crucial for determining the slope of the line.
The Slope Formula: Unlocking the Inclination
The mathematical formula for calculating slope is Slope = Rise / Run. Applying this formula to our example, the slope would be (+3) / (+4) = 0.75. This value represents the slope of the line, which indicates that for every one unit the line moves horizontally, it rises 0.75 units vertically.
The slope formula provides a universal approach to calculating the slope of any straight line on a graph, regardless of its orientation or length. By understanding the principles of rise and run, we can decipher the slope of any line, unlocking critical information about its behavior and direction.
Calculating and Interpreting Slope
When it comes to understanding the behavior of a line on a graph, slope plays a crucial role. It’s like a compass, guiding us through the line’s orientation and intensity. To unravel this enigma, let’s embark on a journey of calculating and interpreting the slope of a line.
Step 1: Identify the *Rise and Run*
Imagine a line on a graph like a path leading to a destination. The rise is the vertical change or height gained as you move along the line, while the run is the horizontal change or distance traveled. These two components are crucial for determining the slope.
Step 2: Apply the Formula
Now, it’s time to quantify the slope. The secret lies in the formula: Slope = Rise / Run. To find the slope, simply divide the rise by the run. For example, if a line goes up 2 units and across 4 units, its slope would be 2 / 4 = 0.5.
Step 3: Interpret the Slope
The slope reveals much about a line’s direction and steepness. A positive slope indicates that the line slants upward to the right, while a negative slope means it descends to the left. The magnitude of the slope tells us how steep the line is: a larger absolute value indicates a steeper slope.
Calculating and interpreting slope is a valuable skill that unlocks a world of information about lines on a graph. Whether you’re studying motion in physics or analyzing financial data, understanding slope empowers you to make informed decisions and gain insights into the behavior of the world around you.