Unlocking Functional Group Insights With Ftir Spectroscopy: A Comprehensive Guide
Reading FTIR spectra involves analyzing absorption bands that indicate functional groups. Identifying the atomic arrangements of functional groups correlates to characteristic absorption bands. Peak height represents functional group concentration, while peak shape suggests molecular environment and hydrogen bonding. Peak wavenumbers determine functional group identity. Resolution influences spectral detail. Calibrating relationships between spectra and known concentrations enhances data analysis. Transmittance values supplement absorbance measurements.
Unveiling the Secrets of Molecules: A Journey into FTIR Spectroscopy
In the vast world of chemical analysis, FTIR spectroscopy stands as a powerful tool for deciphering the intricate makeup of molecules. Fourier transform infrared spectroscopy shines a light on the molecular vibrations of a sample, providing a unique fingerprint that reveals its chemical composition.
FTIR spectroscopy has revolutionized our ability to identify and characterize organic and inorganic compounds, polymers, and even biological materials. It offers a non-destructive and rapid method for exploring the chemical landscape of these materials, making it indispensable in various scientific fields and industries.
From quality control in manufacturing to forensic investigations and medical diagnostics, FTIR spectroscopy plays a crucial role in advancing our understanding of the molecular world and its applications in our daily lives. As we delve deeper into this fascinating technique, we will uncover the secrets hidden within the vibrational dance of molecules.
Concepts in FTIR Spectroscopy: Unraveling the Secrets of Functional Groups
Understanding Absorption Bands: The Fingerprint of Functional Groups
FTIR (Fourier transform infrared) spectroscopy provides a unique window into the chemical composition of materials. When infrared radiation interacts with a molecule, it can cause certain chemical bonds to vibrate. The resulting absorption bands in the FTIR spectrum provide a distinct fingerprint, revealing the presence of specific functional groups. These functional groups are the building blocks of molecules and determine their chemical behavior and properties.
Applications of Attenuated Total Reflectance (ATR) for Surface Analysis
ATR is a powerful technique that extends the capabilities of FTIR spectroscopy to surface analysis. By using an ATR crystal, the infrared beam is reflected off the surface of the sample, allowing for the characterization of only the surface layer. This makes ATR ideal for studying thin films, coatings, or other surface-related properties.
Importance of a Flat and Noise-Free Baseline for Accurate Measurements
In FTIR spectroscopy, a flat and noise-free baseline is crucial for accurate data interpretation. Baseline distortions can obscure important absorption bands or introduce false readings. Proper sample preparation, background subtraction, and noise reduction techniques are essential to ensure a high-quality spectrum with a clear baseline. By meticulously controlling these factors, scientists can obtain reliable and meaningful FTIR data that accurately reflects the molecular composition of their samples.
Delving into Infrared Spectroscopy: A Journey to Unlock Molecular Secrets
In the realm of chemical analysis, infrared (IR) spectroscopy emerges as a powerful tool for unraveling the hidden secrets of molecules. This technique shines a light on the molecular vibrations within a substance, providing a wealth of information about its composition and structure.
IR spectroscopy operates on the principle that molecules absorb infrared radiation at specific frequencies that correspond to their vibrational modes. These vibrations are influenced by the molecular structure, including the bonds and atomic arrangements. By capturing and analyzing the IR spectrum, we can identify the functional groups present in the molecule.
Mid-Infrared (MIR) and Near-Infrared (NIR) Spectroscopy: Distinct Spectral Regions
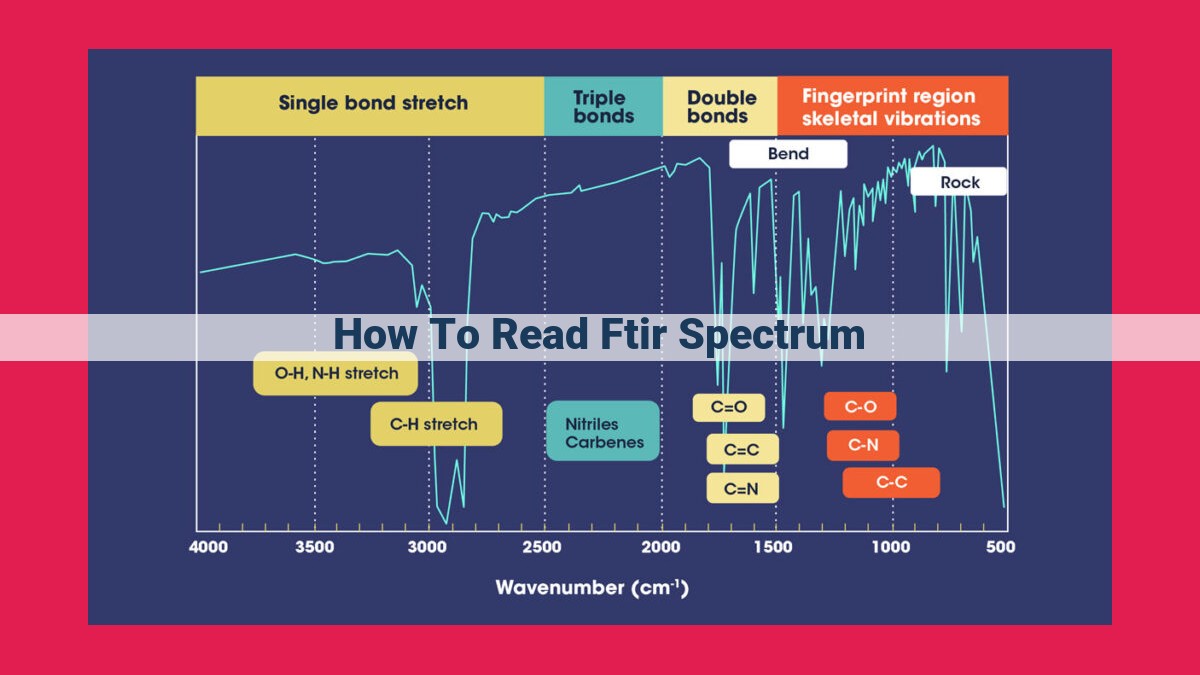
The IR spectrum is divided into two major regions: mid-infrared (MIR) and near-infrared (NIR). Each region offers unique insights into molecular behavior. MIR spectroscopy, ranging from 4000 to 400 cm-1, excels in detecting functional groups and identifying molecular structures. NIR spectroscopy, covering from 12500 to 4000 cm-1, proves valuable for analyzing overtones and combination bands, which provide additional information about molecular conformations and hydrogen bonding.
Functional Groups: The Building Blocks of Infrared Spectroscopy
In the realm of chemical analysis, FTIR spectroscopy emerges as a powerful tool for identifying the molecular composition of substances. This technique shines a light on the specific atomic arrangements that define functional groups, the building blocks that govern the chemical behavior of molecules.
Functional groups are characterized by their unique patterns of absorption bands in an infrared spectrum. These absorption bands are fingerprints that reveal the presence of specific functional groups, such as hydroxyl, carbonyl, and amine groups. By understanding the correlation between functional groups and their characteristic absorption bands, scientists can decipher the molecular structure of a sample with remarkable accuracy.
The classification of functional groups is based on their specific atomic arrangements and the types of atoms they contain. For instance, alkanes contain only carbon and hydrogen atoms, while alcohols possess a hydroxyl group (-OH), aldehydes have a carbonyl group (-C=O), and amines feature a nitrogen atom with lone pairs of electrons.
Each functional group exhibits its own unique absorption bands in the infrared spectrum. For example, the hydroxyl group gives rise to a broad absorption band around 3300 cm-1, while the carbonyl group generates a sharp peak at approximately 1700 cm-1. By correlating these absorption bands with the corresponding functional groups, scientists can identify the molecular components of a sample with great precision.
Unraveling the Secrets of IR Spectra: A Guide to Spectrum Interpretation
When it comes to identifying and characterizing functional groups within a molecule, FTIR (Fourier-transform infrared) spectroscopy emerges as a powerful analytical tool. To unlock the wealth of information encoded within an IR spectrum, we must delve into the art of spectrum interpretation.
Peak Height: A Reflection of Functional Group Abundance
The intensity of an IR absorption band, reflected in its peak height, serves as a direct indicator of the concentration of the corresponding functional group. The higher the peak height, the more abundant the functional group within the sample. This relationship provides valuable insights into the relative amounts of different functional groups present.
Peak Shape: Unveiling Molecular Environment and Hydrogen Bonding
Beyond peak height, the shape of an absorption band can reveal intricate details about the molecular environment surrounding the functional group. Sharp, well-defined peaks often indicate isolated functional groups, while broader peaks suggest interactions such as hydrogen bonding or molecular aggregation. By interpreting peak shapes, we can gain deeper insights into the structural features of the molecule.
Peak Wavenumbers: The Fingerprint of Functional Groups
The peak wavenumber of an absorption band holds the key to identifying the specific functional group responsible for its presence. Each functional group exhibits characteristic IR absorption bands at specific wavenumbers, creating a unique spectroscopic fingerprint. Armed with reference spectra and a keen eye for detail, we can pinpoint the exact identity of functional groups.
Spectrometer Parameters
- Impact of resolution on spectral detail and peak separation.
- Considerations for sample preparation techniques to optimize IR spectrum quality.
Spectrometer Parameters: Unveiling the Secrets of IR Analysis
The heart of FTIR spectroscopy lies in its spectrometer, a precision instrument responsible for capturing and interpreting infrared radiation. Two key parameters, resolution and sample preparation, play a pivotal role in determining the quality and reliability of the resulting spectra.
Resolution: The Fine Art of Spectral Detail
Imagine a symphony orchestra with each musician playing a unique note. The overall sound can be harmonious, but without sufficient resolution, it becomes difficult to distinguish individual instruments. Similarly, in FTIR spectroscopy, resolution determines the level of detail in the spectrum. Higher resolution spectrometers produce spectra with sharper, well-defined peaks, allowing for finer distinctions between absorption bands. This precision is crucial for detecting subtle changes in molecular structure and identifying specific functional groups.
Sample Preparation: The Foundation for Accurate Spectra
Just as a chef carefully prepares ingredients to enhance the flavor of a dish, proper sample preparation is essential in FTIR spectroscopy. The sample must be presented in a way that minimizes noise and interference, providing a clear signal for the spectrometer to analyze. Techniques like grinding, diluting, and using appropriate solvents or matrices can optimize sample presentation, ensuring accurate and reproducible results.
By carefully considering the impact of spectrometer parameters, scientists can harness the full potential of FTIR spectroscopy to unlock the secrets of molecular structure.
Data Analysis in FTIR Spectroscopy: Unveiling the Secrets of Molecular Structures
In the realm of FTIR spectroscopy, data analysis holds the key to deciphering the intricate molecular structures that lie hidden within samples. Calibration procedures play a pivotal role in establishing precise relationships between the IR spectra and known concentrations of compounds. By meticulously crafting calibration curves, scientists can accurately quantify the abundance of specific functional groups or molecules in their samples.
Another valuable aspect of data analysis is the utilization of transmittance values as a complementary measure to absorbance. Transmittance, which is defined as the ratio of light intensity transmitted through the sample to the intensity of the incident light, provides additional insights into the sample’s absorption characteristics. By examining both absorbance and transmittance data, researchers can gain a more comprehensive understanding of the molecular processes at play.
Through advanced data analysis techniques, FTIR spectroscopy transforms raw spectral data into a treasure trove of information. It empowers scientists to identify and quantify functional groups, elucidate molecular structures, and unlock the secrets of complex chemical systems.
