Complete Guide To Drawing Shear And Moment Diagrams For Engineers
To draw shear and moment diagrams, determine reactions and calculate shear force. Plot the shear diagram to visualize the force along the beam. Next, calculate the bending moment and plot the moment diagram to visualize how the beam bends. Consider reactions, load types, and beam properties like moment of inertia and section modulus. By following these steps, you can effectively analyze the forces acting on a beam and design it to withstand the loading.
In the world of structural engineering, beams play a pivotal role in supporting and distributing loads. To ensure their integrity, engineers rely on two key concepts: shear forces and bending moments. These forces reveal the internal stresses within a beam and are crucial for designing structures that can withstand the rigors of everyday life.
Shear forces act parallel to the beam’s cross-section, like a pair of scissors cutting through paper. They develop when forces are applied perpendicular to the beam’s axis, causing it to twist and distort. Bending moments, on the other hand, are forces that cause the beam to bend or curve. They arise from forces applied parallel to the beam’s length, like when you press down on a diving board.
Understanding these forces is essential because they determine the beam’s critical points, where it experiences the greatest stresses. By analyzing shear and bending moment diagrams, engineers can identify these critical points and ensure that the beam is strong enough to handle the anticipated loads without failing.
Shear Diagrams: A Visual Guide to Beam Analysis
In the realm of structural engineering, shear forces are the invisible forces that act parallel to the cross-section of a beam, attempting to tear it apart. Bending moments, on the other hand, are the unseen forces that try to bend the beam, causing it to deflect. Understanding these forces is crucial for designing safe and efficient beams.
Shear diagrams are graphical representations that visualize shear forces throughout the length of a beam. They enable engineers to identify critical points where the beam is most vulnerable to failure. To calculate shear force, we use the equation:
Shear Force (V) = Concentrated Load (P) * Distance from Reaction
The shape of shear diagrams varies depending on the type of load applied to the beam. For a concentrated load (a single point load), the shear diagram will be a straight line with a positive slope if the load is applied downward and a negative slope if the load is applied upward. For a uniformly distributed load (a load spread over a certain length), the shear diagram will be a triangle with its peak at the center of the beam.
Understanding shear diagrams is essential for analyzing beams. They help us identify:
- Maximum shear force: This is the highest shear force acting on the beam and is critical for determining the beam’s strength.
- Points of zero shear: These points divide the beam into sections where the shear force changes direction.
- Critical sections: These are locations where the shear force is maximum or changes sign, indicating potential failure points.
Moment Diagrams: Delving into the Essence of Bending
In the realm of beam analysis, moment diagrams play a pivotal role in deciphering the stresses and strains that beams encounter under the influence of external forces. These diagrams provide a visual representation of the bending moment distribution along the beam’s length, giving engineers invaluable insights into the structural behavior of the member.
The bending moment is a measure of the internal force that resists the tendency of a beam to bend or deflect. It is calculated by multiplying the force acting on the beam by the perpendicular distance from the point of application to the neutral axis of the beam.
Moment diagrams can be constructed for various types of loads, including point loads, distributed loads, and moments. Each type of load imparts a distinct shape to the moment diagram, reflecting the manner in which it affects the beam’s bending behavior.
For point loads, the moment diagram will typically exhibit a sharp peak at the point of application, with the magnitude of the peak corresponding to the load’s magnitude.
In the case of distributed loads, the moment diagram will generally take on a parabolic shape, with the maximum moment occurring at the midpoint of the load’s distribution.
When a moment is applied to a beam, the moment diagram will consist of a straight line whose slope is proportional to the moment’s magnitude.
Understanding the shape of moment diagrams is crucial for beam design. By identifying the critical points where the maximum bending moment occurs, engineers can determine the required strength of the beam to resist failure.
To construct a moment diagram, the following steps can be followed:
- Calculate the beam’s reactions at its supports.
- Determine the shear force at various points along the beam.
- Integrate the shear force to obtain the bending moment.
- Plot the bending moment values to construct the moment diagram.
Moment diagrams are indispensable tools for structural engineers, enabling them to assess the bending stresses and design beams that can safely withstand the imposed loads. By visualizing the distribution of bending moments, engineers can optimize beam design, ensuring both structural integrity and efficient material utilization.
Understanding Shear and Moment Diagrams for Beam Analysis: A Comprehensive Guide
Related Concepts
Reactions:
Before delving into shear and moment diagrams, it’s crucial to grasp the concept of reactions. Reactions represent the supporting forces exerted by the structure or supports on the beam to maintain equilibrium. Reactions are essential for determining the overall behavior of the beam under various loading conditions.
Distributed and Point Loads:
Loads acting on beams can be classified as either distributed or point loads. Distributed loads spread uniformly over a length of the beam, while point loads concentrate at specific locations along the beam. Understanding the type and distribution of loads helps predict their impact on shear and moment diagrams.
Moment of Inertia and Section Modulus:
The moment of inertia (I) and section modulus (S) are two critical geometric properties of a beam’s cross-section. These properties influence a beam’s resistance to bending and deflection. Higher values of I and S indicate a beam’s ability to withstand bending moments and shear forces more effectively.
Step-by-Step Guide to Drawing Shear and Moment Diagrams:
- List the steps involved in drawing these diagrams, including:
- Determining reactions
- Calculating shear force
- Plotting shear diagram
- Calculating bending moment
- Plotting moment diagram
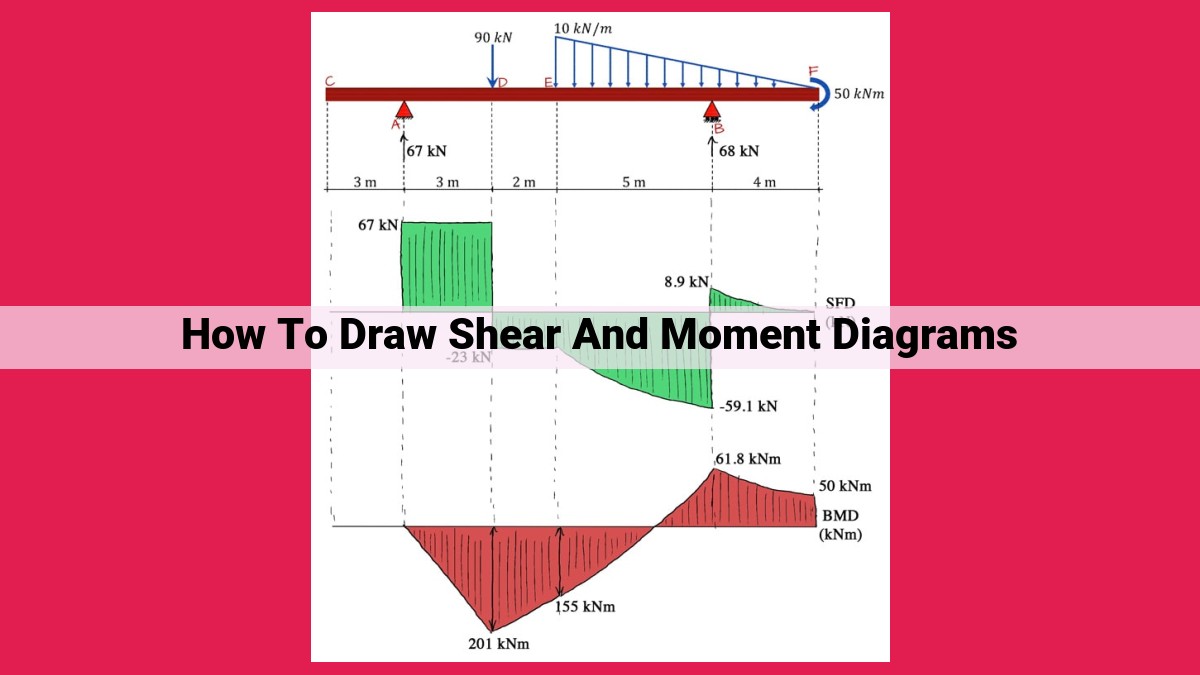
Step-by-Step Guide to Drawing Shear and Moment Diagrams
Understanding the forces acting on beams is crucial for structural engineers and designers. Shear forces and bending moments are two primary forces that need to be considered carefully to ensure the safety and integrity of any structure involving beams. Drawing shear and moment diagrams is a fundamental skill for visualizing these forces and identifying critical points in a beam.
To draw these diagrams accurately, follow these steps:
-
Determine reactions: Begin by calculating the reactions at the supports of the beam. This involves applying the equations of equilibrium to determine the forces and moments acting on the beam at the supports.
-
Calculate shear force: Calculate the shear force at any point along the beam by summing up all the forces acting to the left or right of that point. The shear force is essentially the rate of change of bending moment.
-
Plot shear diagram: Once the shear forces have been calculated, plot them on a graph with the beam’s length on the horizontal axis and the shear force on the vertical axis. The resulting graph is known as the shear diagram.
-
Calculate bending moment: Calculate the bending moment at any point along the beam by summing up all the moments acting on the beam to the left or right of that point. The bending moment represents the tendency of the beam to bend at that point.
-
Plot moment diagram: Similar to the shear diagram, plot the bending moments on a graph with the beam’s length on the horizontal axis and the bending moment on the vertical axis. This graph is called the moment diagram.
By following these steps, you can create detailed shear and moment diagrams that provide valuable insights into the behavior of beams under various loading conditions. These diagrams serve as essential tools for optimizing beam design, ensuring structural stability, and preventing failures.