Unveiling The Limit Of Detection: A Guide To Accurate Analytical Measurements
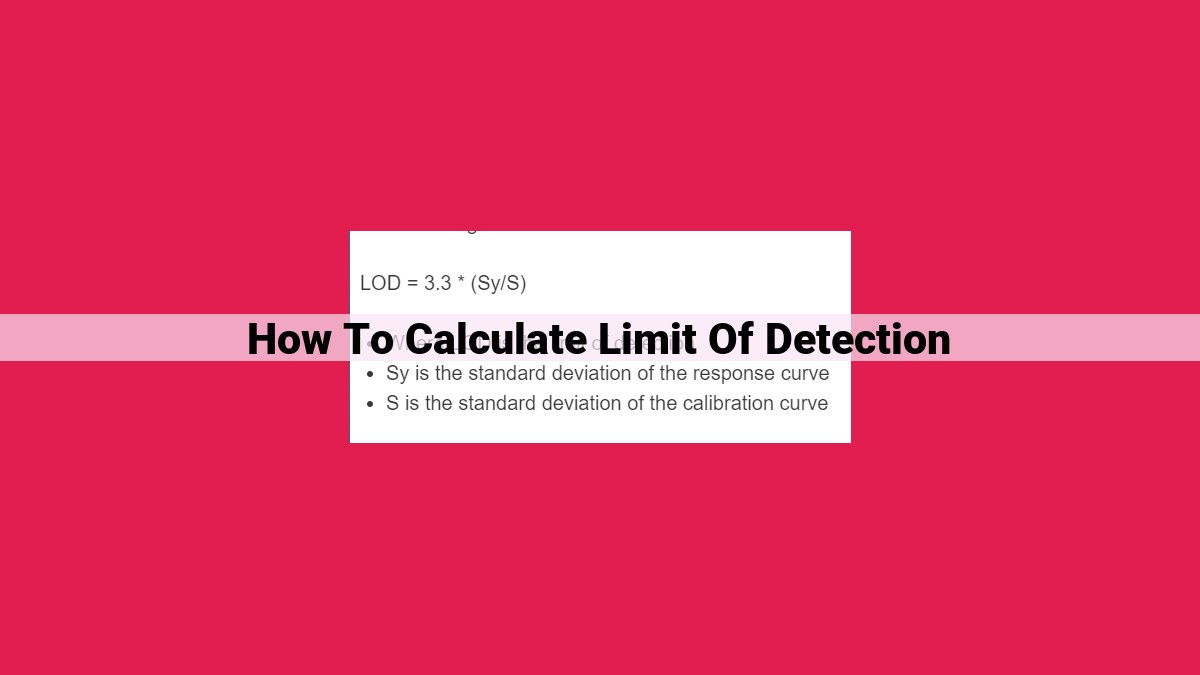
To calculate the Limit of Detection (LOD), use the formula LOD = (3.3 × Standard Deviation of Background) / Sensitivity. The LOD represents the lowest analyte concentration that can be reliably detected above background noise. It considers sample variability, background interference, and the sensitivity of the analytical method. Sensitivity is calculated from the calibration curve, which plots analyte concentration against instrument response. The ratio of the change in response to the change in concentration gives the sensitivity. By considering these factors, the LOD calculation helps establish the minimum detectable concentration in analytical measurements.
Understanding the Limit of Detection (LOD) in Analytical Measurements
In the realm of analytical measurements, the concept of the Limit of Detection (LOD) holds immense significance. It represents the point at which a signal can be distinguished from the background noise. Put simply, LOD tells us the minimum amount of a substance that can be reliably detected in a sample.
This knowledge is crucial for scientists and technicians alike. By understanding the LOD, we can establish the sensitivity of our analytical methods and determine whether they are fit for the purpose at hand. The LOD is an essential parameter that guides us in interpreting experimental data and ensuring the accuracy of our findings.
Background Noise: The Hidden Interference in Analytical Measurements
When it comes to analytical measurements, the ability to detect the presence of a substance is crucial. However, there’s a hidden challenge that can hinder our accuracy: background noise.
Defining Background Noise
Background noise is the unwanted signal that interferes with the detection of the desired signal. It can originate from various sources, such as the instrument itself, reagents, or environmental factors.
Impact on Limit of Detection (LOD) and Signal-to-Noise Ratio (SNR)
Background noise has a significant impact on two crucial parameters: LOD and SNR.
LOD is the minimum concentration of a substance that can be reliably detected. Background noise can obscure low-level signals, making it challenging to determine the presence of a substance below the LOD.
SNR is the ratio of the signal strength to the background noise. A higher SNR indicates a more distinct signal, which improves the accuracy of the measurement. Background noise reduces SNR, making it more difficult to distinguish the signal from the noise.
Consequences of Ignoring Background Noise
Neglecting background noise can lead to false negatives (failing to detect a substance present) and inflated LOD values, compromising the reliability and sensitivity of the analytical method.
Background noise is a crucial factor to consider in analytical measurements. It can significantly affect the LOD and SNR, potentially leading to inaccurate results. By understanding the nature and impact of background noise, analysts can develop strategies to minimize its interference and ensure the accuracy of their measurements.
Sample Variability: Embracing Uncertainty in Analytical Measurements
Every sample we analyze in the laboratory is unique, inherently carrying its own variability. This variability stems from a multitude of factors, such as differences in sample collection, preparation, and storage conditions. It can have a significant impact on the accuracy and precision of our analytical measurements.
In the context of Limit of Detection (LOD) determination, sample variability introduces an element of uncertainty. When we construct a calibration curve, we use a series of known standards to establish a relationship between the signal we measure and the concentration of the analyte in the sample. However, due to sample variability, the signal we obtain from a sample may deviate from the expected value predicted by the calibration curve.
To account for this uncertainty, we need to incorporate sample variability into our LOD calculations. The LOD is typically defined as the minimum concentration of an analyte that can be reliably detected above the background noise. In the presence of sample variability, the LOD is adjusted to ensure that we can confidently distinguish between a true signal and random noise.
In practice, sample variability is often assessed through replicate measurements. By analyzing multiple aliquots of the same sample, we can estimate the standard deviation of the signal. This standard deviation is then used to calculate the LOD.
Embracing sample variability is crucial for accurate and reliable analytical measurements. By understanding and accounting for this uncertainty, we can ensure that our results are meaningful and defensible.
Calibration Curve: A Roadmap to Detection
In the realm of analytical measurements, the calibration curve emerges as a crucial tool, guiding us towards precise detection of target analytes. It serves as a roadmap, charting the relationship between known concentrations of a substance and the corresponding signal responses obtained from analytical instruments.
This roadmap plays a pivotal role in determining both sensitivity and limit of detection (LOD). The sensitivity of an analytical method refers to its ability to discern subtle changes in target concentrations. A higher sensitivity translates into a steeper slope of the calibration curve, allowing for more accurate quantification of analytes, especially at lower concentrations.
The calibration curve also forms the basis for calculating the LOD. This critical parameter establishes the minimal concentration of an analyte that can be reliably distinguished from background noise. By analyzing the relationship between known concentrations and signal responses, we can extrapolate the LOD value, providing a benchmark for reliable detection.
The construction of a calibration curve involves the use of calibration standards, solutions with precisely known concentrations. By analyzing these standards, we establish a linear relationship between concentration and signal, creating a roadmap for analyte detection. However, it’s crucial to consider the impact of sample variability on the calibration curve.
Sample variability refers to the inherent heterogeneity observed in real-world samples. This variability can influence the signal responses obtained from analytical instruments, potentially affecting the calibration curve and, consequently, the LOD determination. To account for this variability, it’s essential to replicate measurements and carefully evaluate the data to ensure reliable conclusions.
The calibration curve is a cornerstone of analytical measurements, providing a framework for sensitivity and LOD determination. By understanding its principles and employing it effectively, we can optimize our analytical methods and make informed decisions regarding the detection of analytes in real-world samples.
Sensitivity: The Amplifier of Signal Strength
Grasping Sensitivity: The Key to Unlocking Accurate Detection
In the realm of analytical measurements, understanding sensitivity is paramount to determining the signal strength of a target analyte. Sensitivity refers to the ability of an analytical method to discriminate between different concentrations of the analyte of interest.
The Connection: Calibration Curve and Limit of Detection (LOD)
Sensitivity plays a crucial role in the calibration curve, a graphical representation of the relationship between the signal produced by the analyte and its known concentration. By analyzing the calibration curve, we can determine the slope, which indicates the sensitivity of the method.
The LOD, a crucial parameter in analytical chemistry, is inversely proportional to sensitivity. A higher slope of the calibration curve translates to a lower LOD, meaning the method can detect smaller concentrations of the analyte.
Significance: Enhancing Analytical Accuracy
Enhanced sensitivity leads to improved analytical accuracy. By amplifying the signal strength, we can reduce the impact of background noise and sample variability. This improves the precision and reliability of our measurements, ensuring that we confidently identify and quantify the target analyte.
Practical Implications:
Understanding sensitivity is essential for:
-
Setting appropriate LODs for analytical methods
-
Evaluating the performance of different analytical techniques
-
Troubleshooting issues related to accuracy and precision
-
Optimizing analytical procedures to enhance sensitivity and minimize noise
SNR: A Measure of Confidence
When it comes to analytical measurements, determining the limit of detection (LOD) is crucial. One key factor that influences LOD is the signal-to-noise ratio (SNR). SNR measures the ratio between the strength of the analytical signal and the background noise.
Background noise is an inherent challenge in any measurement. It arises from various sources, such as electronic fluctuations, sample impurities, and environmental factors. Noise can mask analytical signals, making it difficult to distinguish them from the noise floor.
A high SNR indicates that the analytical signal is strong relative to the noise. This makes it easier to detect the signal and determine LOD. Conversely, a low SNR suggests that the noise is overpowering the signal, making detection challenging.
The SNR is calculated as the ratio of the signal amplitude to the standard deviation of the noise. By increasing the signal strength or reducing the noise level, we can improve the SNR and enhance the ability to detect analytes at lower concentrations.
Improving SNR can be achieved through various techniques, such as:
- Using sensitive analytical techniques
- Optimizing sample preparation
- Minimizing electronic noise
- Employing noise reduction algorithms
In summary, SNR is a critical parameter that reflects the confidence in detecting analytes. By understanding SNR and its impact on LOD, analysts can optimize their analytical methods and ensure accurate and reliable results.