Unlock Data Insights: How Percentage Frequency Empowers Data Analysis
To find percentage frequency, first determine the absolute frequency of each value. Then, divide each absolute frequency by the total number of occurrences to find the relative frequency. Finally, multiply the relative frequency by 100 to express it as a percentage. Percentage frequency helps understand data distribution, compare value occurrences, and make informed decisions in areas like market research, quality control, and survey analysis.
Understanding Percentage Frequency
In the realm of statistics, percentage frequency is a crucial concept that unlocks the door to understanding data distribution and comparing value occurrences. It provides a valuable lens through which we can unravel the patterns and trends hidden within a dataset.
Percentage frequency, as the name suggests, expresses the proportion of a specific value or event in relation to the total number of observations in a given population or sample. Population refers to the entire collection of data, while sample represents a representative subset of the population.
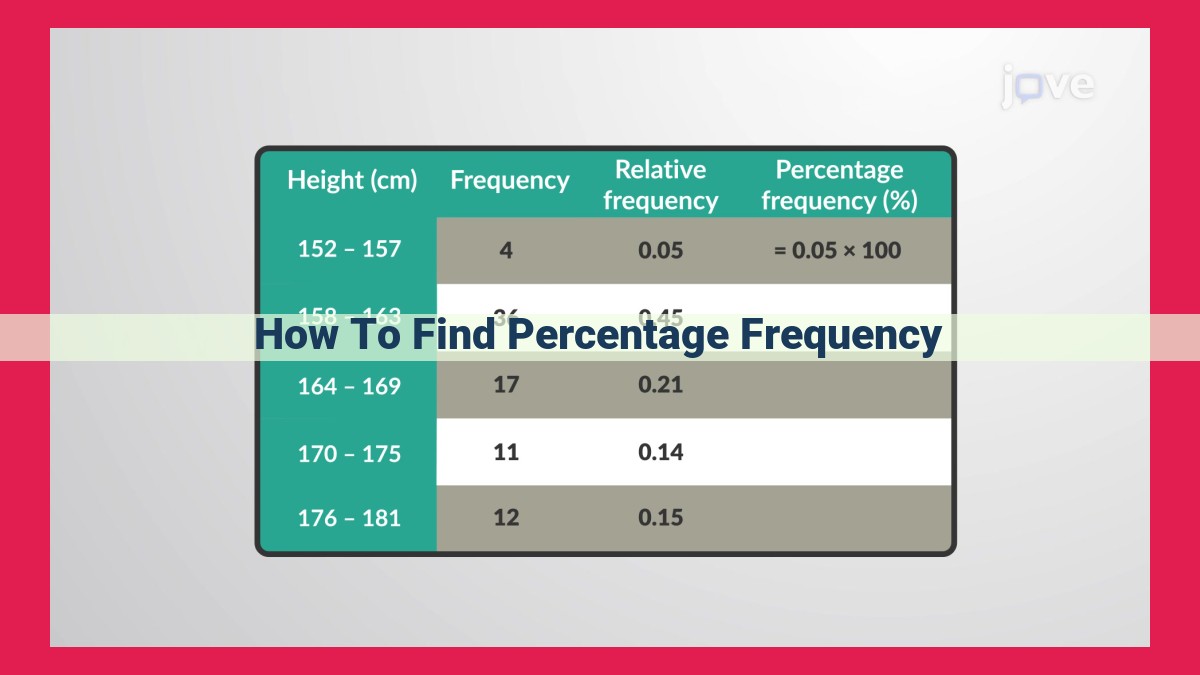
The calculation of percentage frequency is straightforward. We begin by counting the number of times a specific value appears in the dataset, known as its absolute frequency. Next, we divide the absolute frequency by the total number of observations. This division yields the relative frequency, which represents the proportion of the specific value in the dataset.
Finally, to convert the relative frequency into a percentage, we multiply it by 100. This gives us the percentage frequency, which provides a clear and concise measure of the relative prevalence of a specific value.
Key Concepts in Frequency Analysis
In the realm of statistics, understanding the frequency of a specific data point is crucial for extracting meaningful insights from a dataset. Frequency analysis involves counting how often a particular value or event occurs within a given set of data. To enhance our comprehension of frequency analysis, let’s delve into some key concepts:
Absolute Frequency
Absolute frequency, often denoted by f, represents the raw count of how many times a specific value appears in a dataset. For instance, if you have a dataset of ages and the value “25” appears 10 times, then the absolute frequency of 25 is 10.
Relative Frequency
Relative frequency, on the other hand, expresses the _proportion_ of occurrences of a specific value in relation to the total number of occurrences in a dataset. It’s calculated by dividing the absolute frequency of a value by the total number of observations. For example, if the total number of ages in the dataset is 100 and the value “25” occurs 10 times, then the relative frequency of 25 is 10/100 = 0.1.
Population
In statistical analysis, the population refers to the entire set of data under consideration. It represents the complete collection of individuals or objects that are being studied. For example, if you’re analyzing the ages of all students in a school, the population would include every student in that school.
Sample
A sample is a _subset of the population_ that is being analyzed. Researchers often use samples to draw inferences about the larger population. For instance, if you’re studying the ages of all students in a school, you might randomly select a sample of 100 students to represent the entire population.
Calculating Percentage Frequency: A Step-by-Step Guide
Understanding the distribution of data is crucial in statistical analysis. Percentage frequency provides valuable insights by revealing the proportion of occurrences of specific values within a dataset.
Step 1: Determine Absolute Frequency
The first step is to determine the absolute frequency, which is the count of how many times a specific value occurs in the dataset. For example, if we have a dataset of survey responses, and we want to know how many respondents chose “Yes” for a particular question, the absolute frequency would be the count of “Yes” responses.
Step 2: Calculate Relative Frequency
Relative frequency is the proportion of occurrences of a specific value to the total number of occurrences in the dataset. It is calculated by dividing the absolute frequency of the value by the total observations in the dataset. This gives us a value between 0 and 1, where 0 indicates no occurrences and 1 indicates that all observations have that particular value.
Step 3: Convert to Percentage
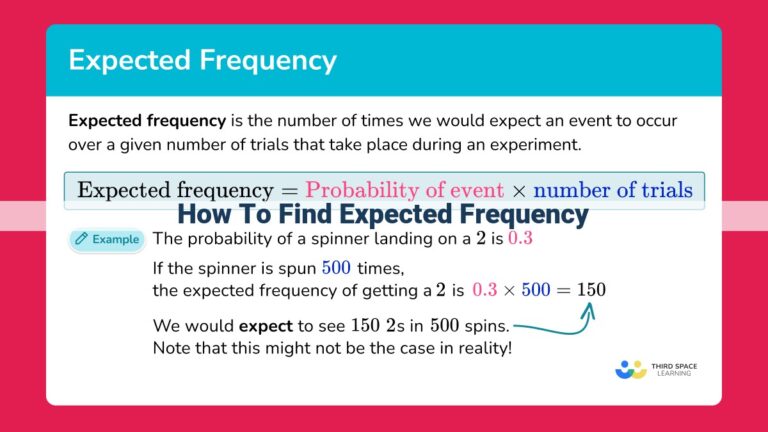
To obtain percentage frequency, we simply multiply the relative frequency by 100. This expresses the proportion of occurrences as a percentage, making it easier to compare the distribution of different values in the dataset.
Formula
The formula for calculating percentage frequency is:
Percentage Frequency = (Absolute Frequency / Total Observations) x 100
Example
Let’s say we have the following dataset of grades in a class:
90, 85, 92, 95, 88, 90, 96, 91, 87, 93
To calculate the percentage frequency of the grade 90, we first determine the absolute frequency, which is 2. Then we calculate the relative frequency by dividing 2 by 10 (total observations): 2 / 10 = 0.2. Finally, we multiply by 100 to obtain the percentage frequency: 0.2 x 100 = 20%.
By understanding percentage frequency and following these steps, you can effectively analyze data distributions and gain valuable insights from your datasets.
The Importance of Percentage Frequency
Understanding data is essential for making informed decisions. And when it comes to analyzing data, percentage frequency is a crucial tool. It provides valuable insights into data distribution and patterns, making it easier for you to understand the bigger picture.
Let’s say you’re working with a dataset of customer purchases. By calculating the percentage frequency of each product purchased, you can quickly identify popular items and spot trends. This information can help you optimize your inventory and make informed decisions about product placement.
Similarly, in medicine, percentage frequency can be used to track disease prevalence and monitor treatment effectiveness. By knowing the percentage of patients who recover from a particular ailment, doctors can better predict outcomes and improve care.
In the field of marketing, percentage frequency can be used to understand consumer behavior. By analyzing the percentage of people who respond to a particular advertisement, marketers can target their campaigns more effectively and increase their return on investment.
Overall, percentage frequency is a versatile tool that can be applied to a wide range of fields. It helps us understand data distribution, compare value occurrences, and make more informed decisions based on the information available.
Applications of Percentage Frequency: Unlocking Insights from Real-World Data
Market Research:
Percentage frequency plays a crucial role in market research by helping businesses gauge customer preferences, brand loyalty, and product performance. By analyzing the percentage of customers who prefer a particular feature, choose a competitor’s product, or express satisfaction with a service, companies can identify market opportunities and make informed decisions.
For example, a survey conducted by a clothing retailer revealed that 75% of respondents preferred cotton fabrics over synthetic materials. This insight led the retailer to focus on expanding its cotton product line, resulting in increased sales.
Quality Control:
Percentage frequency is indispensable in quality control processes, enabling manufacturers to identify defects, monitor production efficiency, and maintain product standards. By calculating the percentage of defective products within a batch, companies can assess the quality of their manufacturing process and implement corrective measures as needed.
In a chemical plant, a quality control manager discovered that 5% of the products failed a safety test. This led to an investigation that uncovered a faulty component in the production line, which was promptly replaced to prevent further defects.
Survey Analysis:
Percentage frequency is extensively used in survey analysis to present data in a clear and concise manner. By expressing responses as percentages, researchers can easily compare different options and draw meaningful conclusions.
For instance, a survey on political preferences found that 45% of respondents supported Candidate A, while 30% supported Candidate B. This information provides a valuable overview of the electorate’s opinions and aids in predicting election outcomes.
Percentage frequency is a powerful statistical tool that unlocks insights from real-world data. From understanding customer preferences to ensuring product quality and analyzing survey results, it plays a vital role in various fields, helping businesses, manufacturers, and researchers make informed decisions and improve their operations. By embracing the power of percentage frequency, organizations can gain a competitive edge and achieve their strategic goals.