Understand The Contribution Margin Ratio: A Guide To Financial Leverage
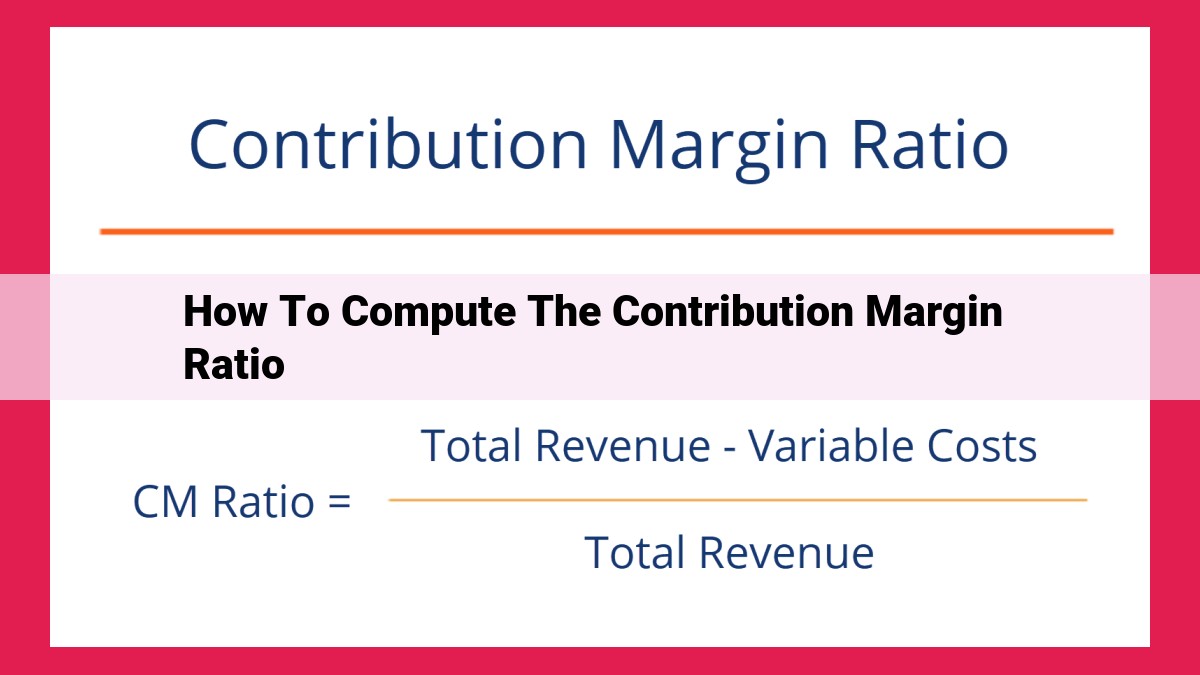
To compute the contribution margin ratio, ascertain the contribution margin (revenue minus variable costs) and divide it by the revenue. This ratio measures the proportion of revenue contributing to fixed costs and profit. It’s a vital indicator of financial leverage and profitability, aiding businesses in optimizing costs and making informed decisions. However, consider its limitations in solely relying on historical data and its inability to account for all profitability factors.
Understanding the Contribution Margin: A Key to Profit Optimization
In the realm of finance, the contribution margin stands as a crucial metric, guiding businesses towards improved profitability and efficient operations. This value represents the portion of revenue that remains after deducting variable costs, the expenses that change directly with the level of production or sales.
To dissect the contribution margin, it’s essential to understand its foundational concepts. Marginal cost refers to the change in total cost incurred when producing one additional unit of output. Gross margin measures the percentage of revenue left after subtracting all direct costs, including variable costs. Direct costs are expenses directly attributable to the production of goods or services, such as raw materials and labor.
By comprehending these concepts, businesses can unravel the secrets of the contribution margin and leverage it for financial success.
Defining and Interpreting the Contribution Margin Ratio
Understanding the contribution margin ratio is a pivotal step in assessing a company’s financial health and operational efficiency. It represents the percentage of revenue that remains after deducting variable costs, providing insights into how effectively a business generates profit.
The contribution margin ratio holds immense significance as a measure of financial leverage. It indicates how a business’s profitability responds to changes in sales volume. A higher ratio signifies that a company can cover fixed costs and generate more profit with a smaller increase in sales, making it more financially resilient.
Related concepts like the break-even point and margin of safety further illuminate the implications of the contribution margin ratio. The break-even point marks the sales volume at which a company’s revenue equals its total costs. The margin of safety represents the cushion between current sales volume and the break-even point, indicating the company’s ability to withstand fluctuating sales.
Calculating the Contribution Margin Ratio: A Step-by-Step Guide
Understanding the contribution margin ratio is crucial for businesses to assess profitability and make informed decisions. To calculate this ratio effectively, several steps are involved. Let’s delve into each step to ensure accurate results.
Step 1: Determine Revenue
Revenue refers to the total income generated from the sale of goods or services. This includes all sales, discounts, returns, and allowances. To calculate the contribution margin ratio, it is essential to have a clear picture of the revenue earned during a specific period.
Step 2: Identify Variable Costs
Variable costs are those that fluctuate with the level of production. These costs include raw materials, direct labor, and other expenses that change proportionally with output. Accurately identifying variable costs is crucial to calculate the contribution margin.
Step 3: Calculate Contribution Margin
The contribution margin is the difference between revenue and variable costs. This margin represents the amount of money that contributes to fixed costs, operating expenses, and profitability. By deducting variable costs from revenue, you can determine the contribution margin.
Step 4: Calculate Contribution Margin Ratio
The contribution margin ratio is expressed as a percentage of revenue. To calculate it, divide the contribution margin by revenue. This ratio indicates the percentage of revenue that is available to cover fixed costs and generate profit. A higher contribution margin ratio generally implies greater profitability potential.
Example:
Let’s assume a company has revenue of $100,000 and variable costs of $60,000.
- Contribution Margin = Revenue – Variable Costs
- Contribution Margin = $100,000 – $60,000
-
Contribution Margin = $40,000
-
Contribution Margin Ratio = Contribution Margin / Revenue
- Contribution Margin Ratio = $40,000 / $100,000
- Contribution Margin Ratio = 40%
In this example, the company has a contribution margin ratio of 40%. This means that 40% of every dollar of revenue is available to cover fixed costs and generate profit.
The Unveiling of the Contribution Margin Ratio: A Journey of Profitability and Efficiency
The Contribution Margin Ratio: A Guiding Star for Business Success
In the labyrinthine world of business finance, the contribution margin ratio emerges as a beacon of clarity. It empowers businesses to illuminate their path to profitability and operational efficiency. By analyzing the ratio, businesses can unveil the secrets to optimizing costs, making informed decisions, and ultimately driving success.
A Compass for Profitability Assessment
The contribution margin ratio serves as a compass for businesses seeking to navigate the treacherous waters of profitability. It provides a quantitative measure of how much each unit of revenue contributed to covering fixed costs and generating profits. The higher the ratio, the greater the proportion of revenue available to meet these crucial expenses.
A Blueprint for Operational Efficiency
Beyond profitability, the contribution margin ratio offers valuable insights into the operational health of an organization. It reveals areas where businesses can streamline processes, reduce costs, and enhance overall efficiency. By identifying products or services with lower contribution margins, companies can strategically allocate resources to maximize their impact on the bottom line.
A Catalyst for Informed Decision-Making
The contribution margin ratio empowers businesses to make *informed_ decisions that drive growth and sustainability. It serves as a valuable tool for:
- Pricing Optimization: Businesses can use the ratio to determine optimal pricing strategies, ensuring that products and services are priced competitively while maintaining healthy margins.
- Product Mix Optimization: By analyzing the contribution margin of each product or service, businesses can make data-driven decisions about which offerings to prioritize and which to phase out.
- Cost Control: The ratio helps businesses identify areas where costs can be reduced or *renegotiated_, improving overall profitability without sacrificing quality.
A Journey to Continuous Improvement
The contribution margin ratio is not merely a static metric, but rather a *dynamic_ tool that can guide businesses on a _continuous_ journey of improvement. By _regularly_ monitoring and analyzing the ratio, companies can _proactively_ identify areas for optimization, adapt to changing market conditions, and stay competitive in the face of challenges.
In essence, the contribution margin ratio is an unveiling of the underlying financial and operational health of a business. It empowers organizations to make informed decisions, optimize costs, and chart a course towards sustainable profitability and efficiency.
Applications of the Contribution Margin Ratio
The contribution margin ratio (CMR) is an invaluable financial tool for businesses looking to optimize operations and drive growth. Here are some compelling real-world examples:
-
Resource Allocation: Productivity Manufacturing uses the CMR to identify products with the highest profit margins. By focusing resources on these products, they can maximize profitability and minimize waste.
-
Pricing Strategies: Zenith Electronics uses the CMR to determine optimal pricing for its products. By understanding the relationship between variable costs and revenue, they can set prices that generate both healthy margins and attract customers.
-
Planning for Growth: BioMed Pharmaceuticals uses the CMR to assess its financial health and make informed decisions about expansion. By evaluating the potential CMR of new products, they can identify growth opportunities with the greatest potential for profitability and long-term success.
-
Financial Performance Analysis: Apex Financial Group uses the CMR to track and evaluate financial performance over time. This helps them identify areas for improvement and implement strategies to enhance profitability.
-
Profitability Analysis: Gray & Co., CPA uses the CMR to compare the profitability of different departments or divisions. This allows them to pinpoint areas that need attention and develop strategies to increase revenue or reduce costs.
-
Cost Optimization: Swift Logistics uses the CMR to identify areas where variable costs can be reduced. By understanding the impact of variable costs on overall profitability, they can implement cost-saving initiatives and improve operational efficiency.
Limitations of the Contribution Margin Ratio
While the contribution margin ratio is a valuable financial tool, it’s important to acknowledge its limitations:
-
Reliance on historical data: The contribution margin ratio is calculated using historical data, which may not accurately reflect future performance. Factors such as changes in technology, market conditions, and consumer behavior can impact profitability.
-
Cannot capture all factors affecting profitability: The contribution margin ratio only considers variable costs, which are directly related to production. It doesn’t account for fixed costs (e.g., rent, salaries), which can significantly impact profitability.
-
Limited predictive power: The contribution margin ratio is not a perfect predictor of future profitability. External factors, such as economic downturns or industry disruptions, can affect profitability even if the contribution margin remains stable.
Implications for Decision-Making
Businesses should be cautious when relying solely on the contribution margin ratio to make decisions. It’s important to consider other financial metrics, such as gross margin, net profit margin, and return on investment (ROI), to gain a more comprehensive understanding of profitability.
Additionally, managers should be aware of the potential limitations of the contribution margin ratio and interpret it in the context of other relevant information. By understanding its strengths and weaknesses, businesses can make informed decisions that optimize profitability and drive growth.