Calculating Measurement Accuracy: Understanding Percentage Uncertainty
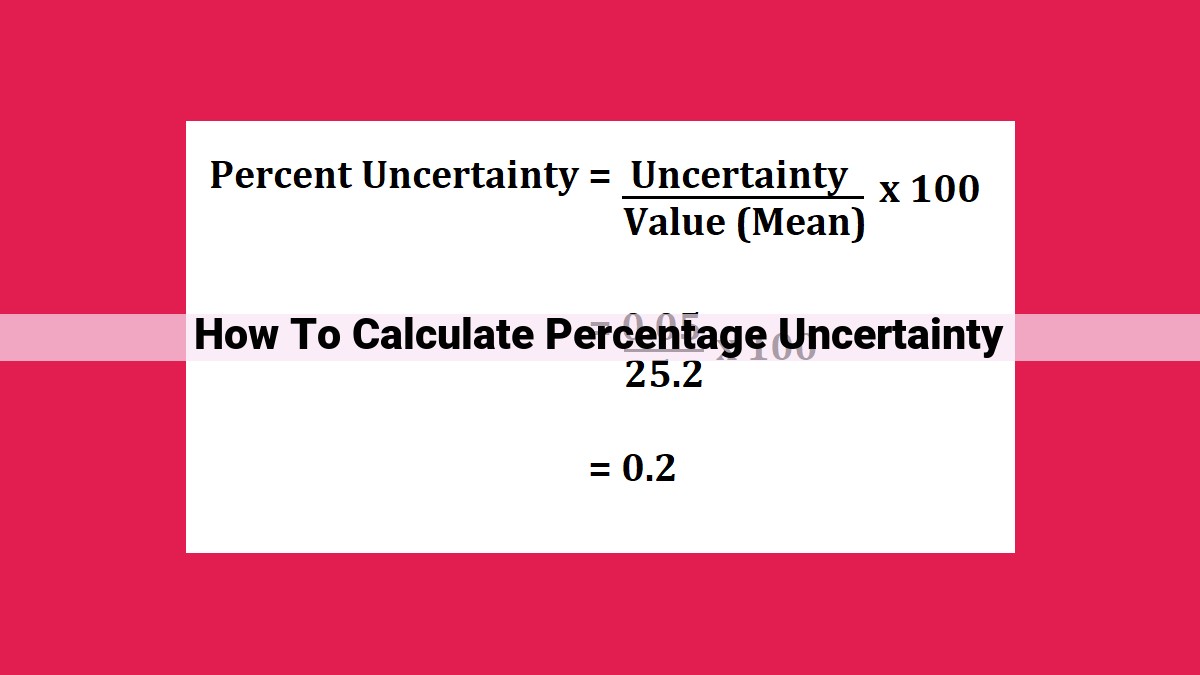
Percentage uncertainty quantifies the accuracy of measurements by calculating the ratio of absolute uncertainty to the mean. Absolute uncertainty is determined by considering the spread of individual measurements, while the mean represents the central tendency. The formula for percentage uncertainty is: (% Uncertainty) = (Absolute Uncertainty / Mean) x 100%. This value indicates the percentage deviation from the true value and helps assess the reliability of measurements. Understanding percentage uncertainty is crucial in scientific and engineering contexts, as it allows for informed judgments about the accuracy and potential errors associated with experimental data and calculations.
Unraveling the Enigma of Uncertainty in Measurements
In the realm of science and engineering, the concept of uncertainty looms large. It’s the inherent imprecision that accompanies every measurement, the intangible cloud that hovers over our data. Understanding uncertainty is paramount in ensuring the reliability of our results and drawing meaningful conclusions from our investigations.
Uncertainty in measurements stems from a myriad of factors, intrinsic and extrinsic. The resolution of our instruments, the environmental conditions under which measurements are taken, and even the limitations of the human senses can all contribute to this ever-present enigma.
Types of Uncertainty: Absolute and Relative
Uncertainty manifests itself in various forms. Absolute uncertainty represents the magnitude of the deviation from the true value, expressed in the same units as the measurement itself. In contrast, relative uncertainty expresses the uncertainty as a percentage of the measured value, providing a normalized measure of the error.
Understanding and quantifying uncertainty is essential in evaluating the validity of our measurements. It allows us to draw informed conclusions, assessing the potential for error and the limitations of our results. By embracing uncertainty, we gain a deeper appreciation for the nuanced nature of scientific and engineering endeavors, where precision and approximation dance in an eternal waltz.
Calculating Absolute Uncertainty
In the realm of measurements, uncertainty lurks like a mischievous specter, casting doubt on the precision of our findings. To tame this elusive beast, we begin by grasping its essence: the eternal dance between accuracy and imprecision.
Absolute uncertainty measures the absolute difference between a measured value and the true value. It is a quantitative measure of our measurement’s spread or variability. Think of it as a cushion around our measurement, accounting for the inevitable wobbles and uncertainties inherent in any physical system.
To calculate absolute uncertainty, we typically subtract the minimum value obtained from the maximum value obtained. For example, if we measure a length with a ruler and get readings of 10.2 cm, 10.4 cm, and 10.3 cm, our absolute uncertainty would be 10.4 cm – 10.2 cm = 0.2 cm.
Absolute uncertainty is a context-dependent concept. Its magnitude often depends on factors such as the measuring instrument’s resolution, the conditions under which the measurement is made, and even the skill of the person taking the measurement.
Understanding absolute uncertainty is crucial for assessing the reliability of our measurements. It helps us estimate the maximum error we can expect in our measurements, providing a basis for making informed decisions.
Understanding Mean (Average) in Uncertainty Analysis
Understanding uncertainty is crucial in scientific measurements. One key element in uncertainty analysis is the mean, also known as the average. The mean provides a central value that represents a set of measurements and helps us assess their dispersion.
Calculating the Mean
The mean is calculated by summing all the values in a dataset and dividing the sum by the number of values. For instance, if we have three measurements: 5, 7, and 9, the mean would be (5 + 7 + 9) / 3 = 7.
The Mean in Uncertainty Analysis
The mean plays a vital role in uncertainty analysis. When considering a range of measurements, the mean offers a representative value that captures the overall trend. It allows us to compare multiple datasets and evaluate their central tendencies.
There are different types of means, each suited for specific scenarios. The most common is the arithmetic mean, which is suitable for most applications. However, in cases with extreme values or skewed distributions, other means like the median or trimmed mean may be more appropriate.
Properties of the Mean
The mean has several noteworthy properties:
- Stability: The mean remains relatively stable even with changes in individual data points, making it a robust measure.
- Central tendency: The mean represents the center point of the distribution, providing an indication of the “typical” value.
- Sampling distribution: The means of repeated samples from the same population tend to follow a normal distribution, which is a crucial concept in statistical inference.
Understanding the mean is fundamental in analyzing uncertainty in measurements. It provides a central value that helps us compare and interpret data. The mean’s properties and different types ensure its versatility in various applications. By incorporating the mean into our uncertainty analysis, we gain a deeper understanding of the reliability and significance of our measurements.
Percentage Uncertainty: Quantifying Measurement Accuracy
Imagine you’re measuring the height of a building using a tape measure. Even with the most precise instrument, there’s always a degree of uncertainty associated with the measurement. How do we quantify this uncertainty and how does it impact the accuracy of our result?
Definition and Formula
Percentage uncertainty, often denoted as “% error,” measures the fractional difference between a measured value and the accepted true value. It’s calculated using the formula:
Percentage uncertainty = (Absolute uncertainty / Accepted value) x 100%
Interpretation and Significance
- Absolute uncertainty: The absolute difference between the measured value and the actual value.
- Accepted value: The value that is assumed to be correct, often obtained from a reference source or calibration.
Percentage uncertainty serves two crucial purposes:
- Assessing Reliability: A lower percentage uncertainty indicates a more reliable measurement.
- Uncertainty Propagation: Percentage uncertainty is essential for combining measurements and propagating uncertainty in calculations. It allows us to estimate the uncertainty in the final result based on the uncertainties in the individual measurements.
Example: Measuring a Box
Let’s say we measure the length of a box using a ruler. We obtain a measurement of 12.3 cm. The accepted length is 12.5 cm. The absolute uncertainty is 0.2 cm.
Percentage uncertainty = (0.2 cm / 12.5 cm) x 100% = **1.6%**
This result tells us that our measurement is slightly different from the accepted value (within 1.6%), which gives us an indication of the accuracy of our result.
Step-by-Step Calculation of Percentage Uncertainty
Navigating the world of measurements often requires us to contend with the concept of uncertainty. But fear not! Understanding percentage uncertainty is like embarking on an exciting adventure that can empower you to assess the reliability of your measurements and make confident decisions based on them. Let’s dive into a step-by-step guide that will unravel the mystery of percentage uncertainty:
-
Gather Your Evidence: Begin by collecting all the relevant data from your measurements. This could include the measured value, the uncertainty associated with the measurement, and any other pertinent information.
-
Calculate Absolute Uncertainty: Determine the absolute uncertainty of your measurement. Remember, absolute uncertainty represents the range of possible values within which your true measurement likely lies.
-
Embrace the Mean: The mean, often referred to as the average, provides a central tendency of your data. It serves as a valuable reference point for understanding your measurement’s distribution.
-
Percentage Uncertainty: The Measure of Accuracy: Now, let’s introduce percentage uncertainty, the protagonist of our story. It’s calculated by dividing the absolute uncertainty by the mean and multiplying by 100. This metric expresses the uncertainty as a percentage of the measurement’s value.
-
Interpreting the Percentage Uncertainty: A lower percentage uncertainty indicates a more precise measurement, meaning it’s closer to the true value. Conversely, a higher percentage uncertainty suggests a less precise measurement.
-
Example Walkthrough: Let’s say you measure the length of a pencil and obtain a value of 15.2 cm, with an absolute uncertainty of 0.3 cm. Using our formula, the percentage uncertainty becomes:
(0.3 cm / 15.2 cm) * 100 = 1.97%
This result implies that the true length of the pencil likely falls within a range of 15.0 cm to 15.4 cm (15.2 cm ± 0.3 cm).
Understanding percentage uncertainty is a crucial skill in science and engineering. It helps us evaluate the reliability of our measurements and make informed decisions. So, embrace this adventure, conquer the mystery of uncertainty, and become a master of reliable measurements!
Importance of Percentage Uncertainty
Understanding percentage uncertainty is crucial for scientists and engineers as it provides valuable insights into the reliability of measurements. Percentage uncertainty is a measure of the imprecision associated with a measurement, quantifying how close a given value is to the true value. By calculating percentage uncertainty, we can assess the accuracy and trustworthiness of our experimental results.
Furthermore, understanding percentage uncertainty is essential when combining or propagating uncertainties in calculations. When multiple measurements are combined (e.g., addition or multiplication), the overall uncertainty of the result is influenced by the uncertainties of the individual measurements. By understanding how uncertainties propagate, we can determine the combined uncertainty of complex calculations, ensuring the accuracy of our conclusions.
Ultimately, percentage uncertainty is a fundamental tool for evaluating the validity of our measurements and understanding their limitations. It helps us make informed decisions about the reliability of our results and guides us in drawing accurate conclusions from our experimental data. By understanding the importance of percentage uncertainty, we can ensure that our scientific and engineering endeavors are based on solid and trustworthy foundations.
Additional Considerations
- Factors affecting percentage uncertainty
- Context-dependent interpretation of uncertainty
Additional Considerations
In measuring the world around us, we encounter uncertainties that stem from various sources. Understanding these factors that influence percentage uncertainty is crucial for accurate interpretation and analysis of our data.
Factors Affecting Percentage Uncertainty
- Instrument Precision: The capabilities of the measuring instrument impact uncertainty. Higher-precision instruments provide measurements with lower uncertainty.
- Measurement Technique: Different measurement methods or observers may yield different results, contributing to uncertainty. Standardizing techniques minimizes this variation.
- Sample Variation: If multiple samples are measured, they may exhibit inherent variability within the population. This variability influences percentage uncertainty.
- Environmental Conditions: Factors like temperature, humidity, or lighting can affect measurements, especially in sensitive experiments. Controlling these conditions reduces uncertainty.
- Human Error: Mistakes or biases can introduce uncertainty. Careful measurement practices and peer review can mitigate human error.
Context-Dependent Interpretation of Uncertainty
Percentage uncertainty is not inherently good or bad; its interpretation depends on the context. In some applications, high uncertainty is acceptable, while in others, it may be unacceptable. The nature of the measurement and its intended use should guide the interpretation of uncertainty.
For instance, in medical diagnostics, low uncertainty in test results is crucial to ensure accurate diagnoses. However, in environmental monitoring, higher uncertainty may be tolerable if the primary goal is to detect broad trends rather than precise values.
Understanding the factors affecting and context-dependent interpretation of percentage uncertainty is paramount. By considering these aspects, scientists and engineers can make informed decisions about the reliability of their measurements and ensure the accuracy of their conclusions. In both academic and industry settings, a thorough understanding of uncertainty is a key component of robust research and decision-making.