Calculate P-Values In R: A Comprehensive Guide For Hypothesis Testing
In R, p-values can be calculated using statistical functions. For a t-test, use t.test(), specifying the sample data and the hypothesized mean. For ANOVA, use aov() followed by summary(), providing the data frame and formula. For Chi-square, use chisq.test(), supplying the contingency table or frequency data. The p-value is then extracted from the output, which represents the probability of obtaining the observed results or more extreme results, assuming the null hypothesis is true.
- Definition and fundamental concepts
- Common types of hypothesis testing: t-test, ANOVA, Chi-square test
Hypothesis Testing: A Comprehensive Guide for Beginners
In the world of data analysis, hypothesis testing plays a crucial role in helping us make informed decisions about the data we collect. It’s a statistical method that allows us to test whether our initial assumptions about the data are valid.
Defining Hypothesis Testing
Hypothesis testing involves formulating two competing hypotheses: the null hypothesis and the alternative hypothesis. The null hypothesis represents the status quo or the assumption we aim to disprove. The alternative hypothesis, on the other hand, represents our research hypothesis or the claim we want to support.
Common Types of Hypothesis Testing
There are several types of hypothesis tests, each designed to test different types of data and assumptions. Some of the most common types include:
- T-test: Used to compare the means of two independent or paired sets of data.
- ANOVA (Analysis of Variance): Used to compare the means of multiple groups of data.
- Chi-square test: Used to test whether two categorical variables are independent of each other.
Understanding the Significance of the P-Value
When we perform a hypothesis test, we calculate a p-value, which represents the probability of obtaining our data under the assumption that the null hypothesis is true. A low p-value suggests that our data is unlikely to occur by chance, and thus we reject the null hypothesis in favor of the alternative hypothesis.
The Significance Level
The significance level, often denoted as alpha, is a pre-determined threshold that helps us decide whether to reject the null hypothesis. If the p-value is lower than the significance level, we reject the null hypothesis. The most common significance level is 0.05, but it can vary depending on the specific research context.
The Significance of the P-Value
In the realm of statistics, where data speaks volumes, the p-value emerges as a crucial metric that guides our understanding of experimental outcomes. It holds the key to unlocking the mysteries of hypothesis testing, shaping our conclusions and unveiling the truth hidden within the numbers.
The p-value, in its essence, represents the probability of obtaining a test statistic as extreme as, or more extreme than, the one we observed, assuming the null hypothesis is true. It quantifies the strength of evidence against the null hypothesis, the hypothesis that there is no significant difference or effect. A low p-value indicates strong evidence against the null hypothesis, suggesting that the observed difference is unlikely to have occurred by chance alone.
In hypothesis testing, we set a significance level, typically 0.05, which represents the maximum probability we are willing to accept for falsely rejecting the null hypothesis. When the p-value is lower than the significance level, we reject the null hypothesis and conclude that there is statistically significant evidence to support the alternative hypothesis, the hypothesis that there is a significant difference or effect. Conversely, if the p-value is greater than the significance level, we fail to reject the null hypothesis, indicating that there is not enough evidence to suggest a significant difference or effect.
The p-value serves as a gatekeeper, controlling the balance between Type I and Type II errors. A Type I error occurs when we falsely reject the null hypothesis, while a Type II error occurs when we fail to reject a false null hypothesis. By setting an appropriate significance level, we aim to minimize the risk of making both types of errors.
Understanding the p-value is fundamental to interpreting the results of hypothesis testing. It helps us assess the strength of the evidence against the null hypothesis, make informed conclusions, and avoid statistical pitfalls. As we delve deeper into the world of statistics, the p-value will remain our faithful companion, guiding us along the path of data-driven discovery.
Practical Hypothesis Testing with R Functions
- Introduction to key R functions for hypothesis testing: t.test(), aov(), chisq.test()
- Overview of their functionality and usage
Practical Hypothesis Testing with R Functions
In the realm of data analysis, hypothesis testing plays a pivotal role in drawing meaningful conclusions from experimental observations. This process allows us to evaluate the plausibility of a claim or assumption by comparing it to an observed dataset. While hypothesis testing can be a daunting task, the power of R programming can simplify this process, empowering you to test your hypotheses with ease.
Meet the R Functions for Hypothesis Testing
Enter the “Big Three” of R functions for hypothesis testing: t.test(), aov(), and chisq.test(). These functions are your trusted companions in testing various types of hypotheses across different data types.
- t.test(): The go-to function for t-tests, which compare the means of two independent or paired groups.
- aov(): The key player in analysis of variance (ANOVA), allowing you to compare multiple means across groups.
- chisq.test(): Your ally for chi-square tests, which assess the association between categorical variables.
Unveiling the Functionality and Usage
Each of these functions boasts unique capabilities. t.test() enables you to choose between one- or two-sample tests and supports various equality tests (e.g., two-sided, greater than, less than). aov() empowers you to conduct one-way, two-way, or even more complex ANOVAs to determine significant differences among multiple groups. Last but not least, chisq.test() helps you assess the independence of categorical variables and identify associations or differences.
Putting the Power of R to the Test
Let’s explore some practical examples to illustrate how these functions can enhance your hypothesis testing journey.
- Testing the Mean Difference: To compare the mean weight of two independent groups, you can use
t.test()with the appropriate parameters, such asvar.equal=TRUEfor equal variances. - Assessing Group Differences: For more complex comparisons,
aov()comes to the rescue. By specifying the grouping variable, you can identify significant differences among multiple groups. - Exploring Categorical Variables: If you’re working with categorical data,
chisq.test()becomes your ally. It can uncover associations between two categorical variables or test for independence.
So, next time you embark on hypothesis testing, remember the dynamic trio of t.test(), aov(), and chisq.test(). These R functions will not only simplify your statistical adventures but also empower you to draw informed conclusions from your data.
Setting the Significance Level: A Crucial Step in Hypothesis Testing
In the realm of hypothesis testing, the significance level plays a pivotal role, acting as a gatekeeper that determines the fate of our statistical conclusions. Before we dive into the technicalities of calculating p-values, it’s paramount to understand the profound significance of this concept.
The significance level, often denoted by the Greek letter alpha (α), represents the probability of falsely rejecting the null hypothesis. It serves as a threshold, beyond which we consider a result to be statistically significant. This means that if our p-value is less than the significance level, we have strong evidence against the null hypothesis, and we can confidently reject it in favor of the alternative hypothesis.
The appropriate significance level depends on the context of the research and should be carefully considered before conducting the hypothesis test. Typically, a significance level of 0.05 is commonly used, but it can be adjusted based on the severity of the consequences of making a Type I or Type II error.
When setting the significance level, it’s crucial to strike a balance between two competing forces: the stringency of the test and the power of the test. A lower significance level makes the test more stringent, reducing the likelihood of a Type I error (false positive), but also increasing the likelihood of a Type II error (false negative). Conversely, a higher significance level makes the test less stringent, reducing the likelihood of a Type II error, but increasing the likelihood of a Type I error.
Ultimately, the significance level is a critical parameter that helps us draw meaningful conclusions from our hypothesis tests. By understanding its significance and implications, we can make informed decisions about the threshold of evidence required to reject the null hypothesis and make well-founded claims in our research.
Null and Alternative Hypotheses: A Cornerstone of Hypothesis Testing
In the world of statistical inference, hypothesis testing reigns supreme. This method allows us to make informed decisions about data by testing hypotheses and drawing conclusions. Key to this process are the null hypothesis and alternative hypothesis—the two opposing claims we’re examining.
The null hypothesis (often denoted as H0) represents the default or no-difference assumption—the idea that there’s no significant change, difference, or association between variables. In other words, H0 assumes that the current state of affairs is unchanged.
On the flip side, the alternative hypothesis (H1) proposes an alternative scenario. It states that there’s a significant change, difference, or association—the opposite of H0. H1 challenges the null hypothesis, suggesting a different outcome.
Formulating Null and Alternative Hypotheses
Crafting precise hypotheses is crucial. Here are a few guidelines:
- Be Specific: State your hypotheses clearly and concisely. Avoid vague or ambiguous language.
- Testable: Hypotheses should be testable using statistical methods. They can’t be based on subjective opinions or qualitative observations.
- Mutually Exclusive: H0 and H1 should be contradictory—only one can be true at a time. This ensures a clear-cut decision-making process.
In Different Contexts
Hypotheses can take various forms depending on the research question. Here are a few common examples:
- Mean Comparison: H0: μ1 = μ2 (mean of group 1 equals mean of group 2); H1: μ1 ≠ μ2
- Variance Comparison: H0: σ1^2 = σ2^2 (variance of group 1 equals variance of group 2); H1: σ1^2 ≠ σ2^2
- Association Tests: H0: No association between variables X and Y; H1: Association between variables X and Y
Null and alternative hypotheses provide the foundation for hypothesis testing. By understanding their definitions and significance, you’ll be well-equipped to test hypotheses effectively and draw meaningful conclusions from your data. Remember, these hypotheses are not statements of fact—they’re claims to be tested and evaluated. So, craft them carefully and embark on your statistical journey with confidence!
Calculating P-Values in R: A Comprehensive Guide
In the realm of statistics, hypothesis testing holds a central role in drawing inferences about data. At the heart of this process lies the enigmatic p-value, a crucial determinant in validating or rejecting our assumptions. This comprehensive guide will delve into the essence of p-values and provide a step-by-step tutorial on calculating them using R functions.
What is a p-Value?
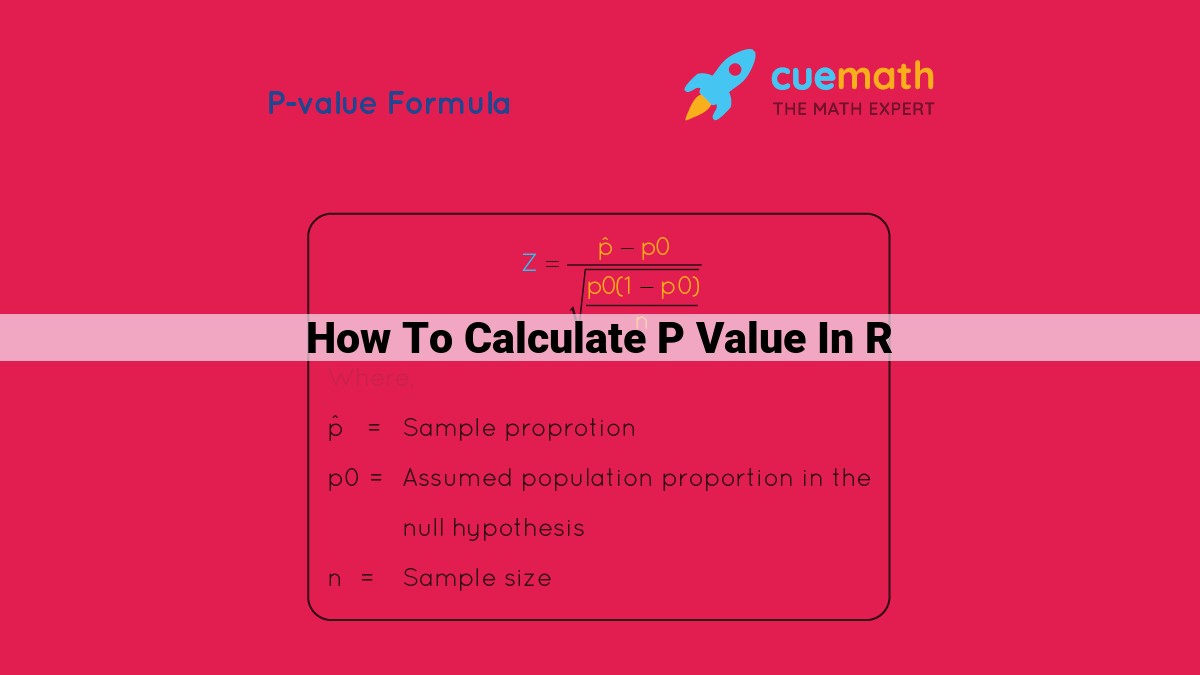
A p-value quantifies the probability of obtaining a test statistic as extreme or more extreme than the observed one, assuming the null hypothesis is true. In other words, it represents the strength of evidence against our null hypothesis.
Null and Alternative Hypotheses
Null hypothesis (H0): Assumes the absence of a significant effect or difference.
Alternative hypothesis (Ha): Specifies the expected effect or difference we are testing for.
Step-by-Step Guide to Calculating P-Values in R
t-Test for Two Independent Groups
t.test(x = data$group1, y = data$group2)
ANOVA (Analysis of Variance)
aov(var ~ group, data = data)
Chi-Square Test
chisq.test(x = data)
Code Implementation Examples
T-Test:
Suppose we have data on the heights of two groups of individuals and want to test if there is a significant difference between them.
t.test(x = group1_heights, y = group2_heights)
ANOVA:
Let’s test if the average sales for different regions are significantly different.
aov(sales ~ region, data = sales_data)
Chi-Square Test:
Consider the following dataset of eye color distribution:
chisq.test(data = eye_color)
Calculating p-values in R empowers us to objectively evaluate our hypotheses and draw informed conclusions from data. By understanding the concepts behind p-values and following the steps outlined here, you can confidently navigate the world of statistical inference.
